
We recently analyzed top e-commerce sellers across 6 major ecommerce platforms to answer the question:
How Much Do Top Ecommerce Sellers Make in 2026?
Specifically, we investigated:
- Average monthly revenue by platform
- Real profit margins and actual take-home earnings
- Top-performing categories by platform
- Geographic revenue variations and market opportunities
- Revenue-to-review efficiency (what each review is actually worth)
- And much more
We also discovered the 521x revenue gap between marketplace and platform sellers, which categories dominate each platform, and the hidden infrastructure costs that determine real profitability.
Using data from BuiltWith, Marketplace Pulse and Clipara, we uncovered some very interesting findings.
And now it’s time to share what we discovered.
Here Are Some of Our Key Findings:
- Marketplace sellers average $433,986 monthly revenue, while other ecommerce platform sellers average $249.6 million monthly revenue—a 521x difference reflecting fundamentally different business models.
- Magento dominates all platforms at $400.77 million average monthly revenue, followed by WooCommerce at $315.02 million, proving Fortune 500 brands require enterprise-grade infrastructure.
- Amazon leads marketplaces at $1.002 million average monthly revenue.
- Health & Supplements command 36.5% of Amazon’s top earner revenue, with Carlyle ($8.5M), eSupplements ($3.7M), and Bayland Health ($3.8M) proving high-AOV repeat purchases generate outsized revenue.
- Jewelry dominates Etsy with 60% of top earners, generating $791K–$1.2M monthly through personalization and artisan positioning—a category virtually absent from other platforms.
- Collectibles capture 47.2% of eBay’s top earner revenue, with ParkerBrand alone generating $1.8M monthly through cards, coins, and memorabilia—proving niche specialization pays.
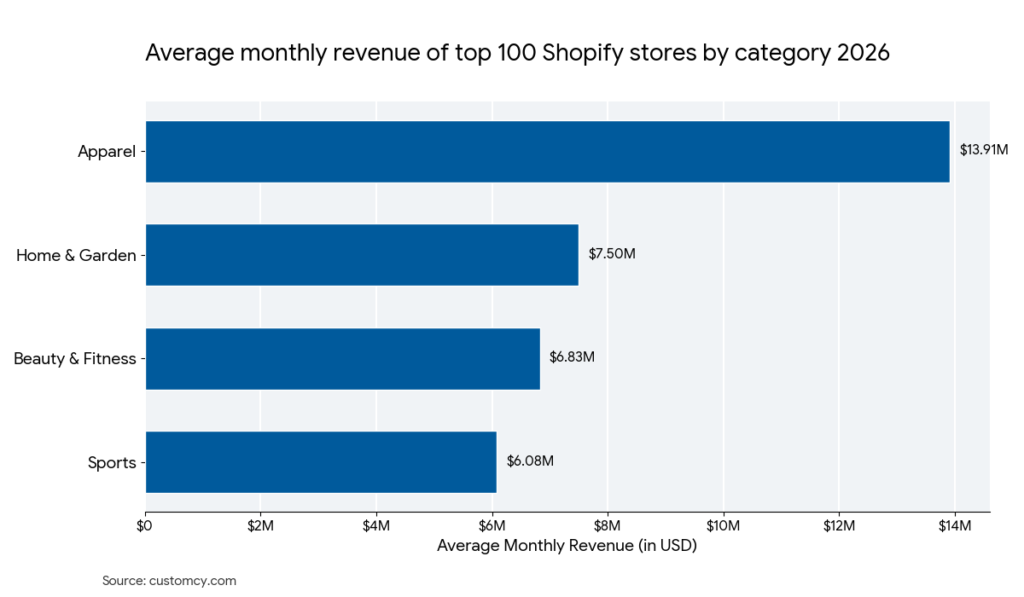
- Apparel is Shopify’s undisputed heavyweight at $13.91M average monthly, more than 10x higher than struggling categories like games ($1.33M), showing category selection determines ceiling potential.
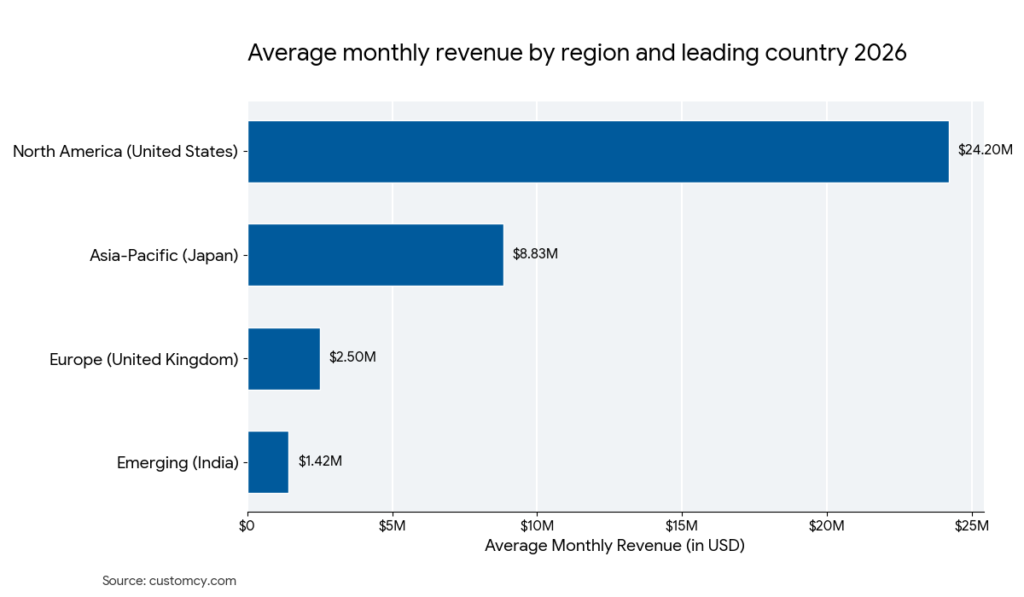
- US Shopify stores average $24.2M monthly revenue—nearly 3x Japan ($8.83M) and 10x the UK ($2.50M)—reflecting America’s dominant buyer pool and mature logistics infrastructure.
- 92% of top Amazon sellers are US-based.
- Shop age doesn’t determine Etsy success—AMJEWELRY NYC at 4 years old hits $1.2M monthly, while 19-year veterans earn less, proving product quality and marketing matter more than longevity.
- India’s Shopify stores average $1.42M monthly revenue, outperforming most European regions and signaling explosive emerging market growth potential.
How Much Do Top E-commerce Sellers Make?
How Much Do Top E-commerce Sellers Make?
On average, marketplace sellers (Amazon, eBay, Etsy) earn $433,986 monthly revenue, while owned-store platforms (Shopify, WooCommerce, Magento) average $249.6 million monthly revenue, reflecting massive differences in scale, control, and business models.
Marketplace economics favor accessibility, not scale. Amazon leads marketplaces with $1.14 million average monthly revenue among top sellers, followed by Etsy ($174K) and eBay ($125K). These platforms lower barriers to entry through built-in traffic and trust but cap upside with fees, competition, and algorithm dependence. Success here is driven by category fit, review velocity, and operational efficiency rather than brand ownership alone.
Owned ecommerce platforms unlock enterprise-scale revenue. Top Shopify sellers average $33.0 million per month, while WooCommerce ($315.0M) and Magento ($400.8M) power large B2B and global retail operations. These platforms demand higher upfront investment—traffic acquisition, infrastructure, teams—but reward sellers with full customer ownership, pricing control, and unlimited scale
E-commerce Platform Revenue Comparison: Which Platform Makes the Most Money?
Magento leads all platforms at $400.77 million average monthly revenue. WooCommerce follows at $315.02 million monthly revenue. These aren’t consumer platforms; they’re enterprise-grade systems powering multinational corporations managing billions in annual transactions.
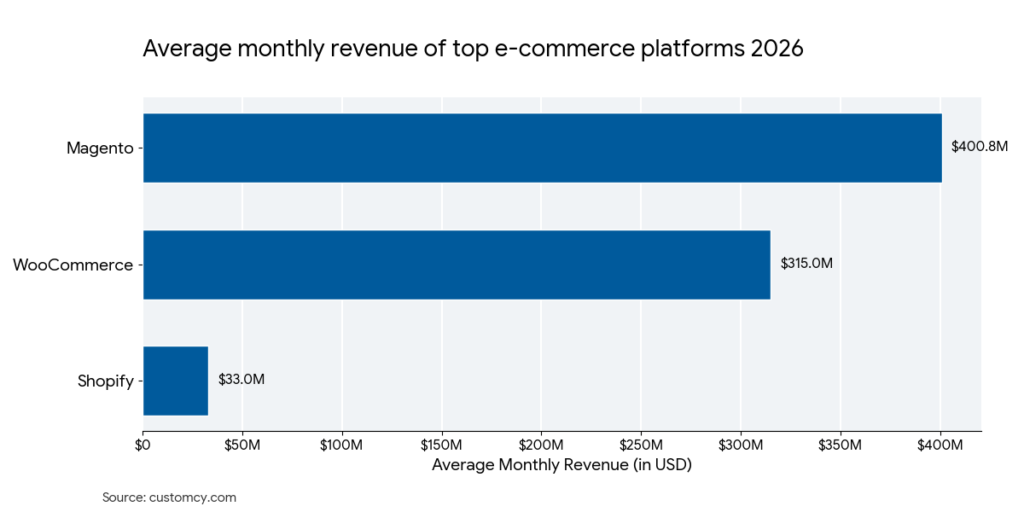
Shopify places third at $33.03 million average monthly revenue—still massive, but representing a completely different seller type. Shopify sellers are ambitious entrepreneurs and established brands building standalone businesses, not global enterprises.
Amazon generates $1.002 million average monthly revenue across its top sellers. While the highest individual seller (Carlyle) hits $8.5M monthly, the average reveals that even Amazon’s elite face saturation and competition.
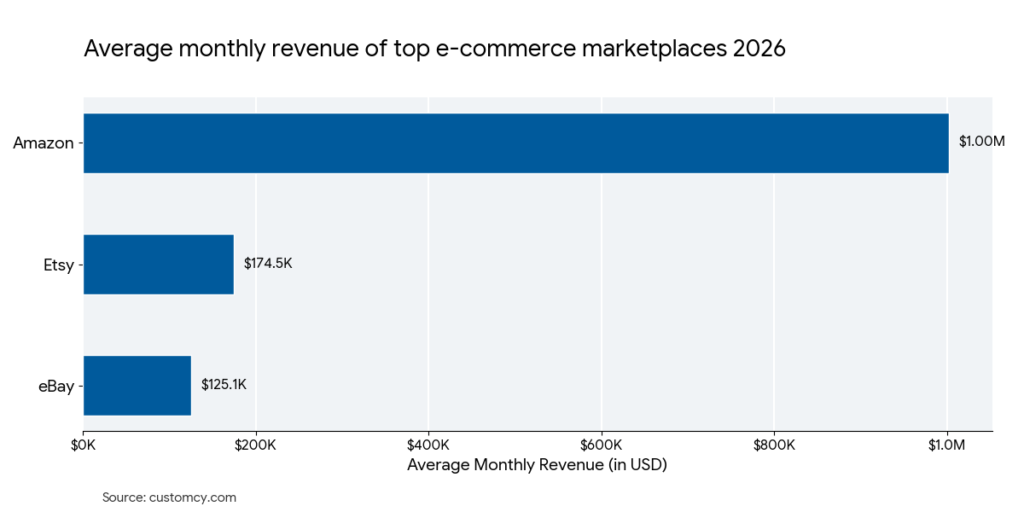
Etsy averages $174,488 monthly revenue, and eBay generates $125,123 monthly revenue. Both are healthy revenues, but they operate at a fraction of Shopify’s scale and a tiny fraction of enterprise platforms.
| Platform | Avg. Monthly Revenue | Avg. Yearly Revenue | Seller Type | Barrier to Entry |
| Magento | $400,770,000 | $4.8B+ | Fortune 500 | Very High |
| WooCommerce | $315,020,000 | $3.78B+ | Enterprise | Very High |
| Shopify | $33,028,483 | $396.3M+ | Ambitious Brands | Moderate |
| Amazon | $1,002,348 | $12.03M+ | Marketplace Sellers | Low |
| Etsy | $174,488 | $2.09M+ | Artisans/Makers | Low |
| eBay | $125,123 | $1.5M+ | Niche Sellers | Low |
Where Top E-commerce Sellers Are Located: The Global Geography of Revenue
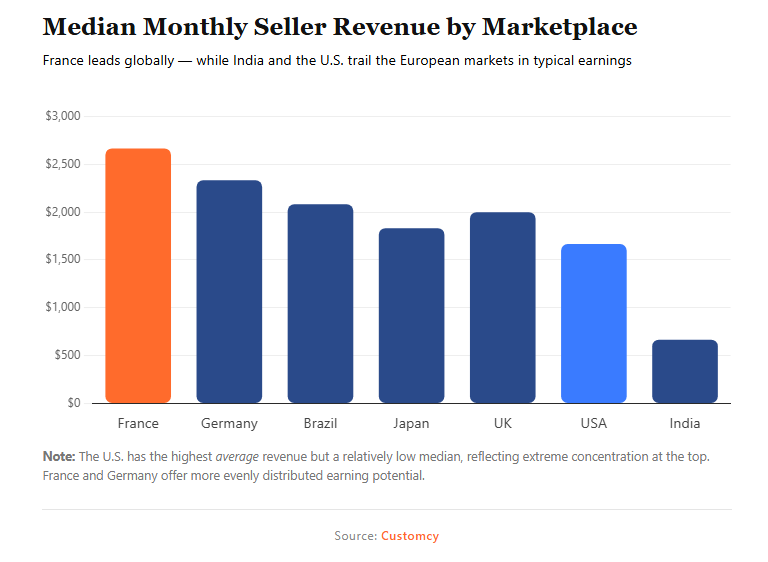
92% of top Amazon sellers are based in the United States. eBay shows a similar pattern, with 90% of its top sellers operating from the U.S. Etsy follows closely, where 74% of top sellers are U.S.-based. On owned-store platforms, 69% of top Woocommerce sellers and 48% of top Magento sellers are headquartered in the United States.
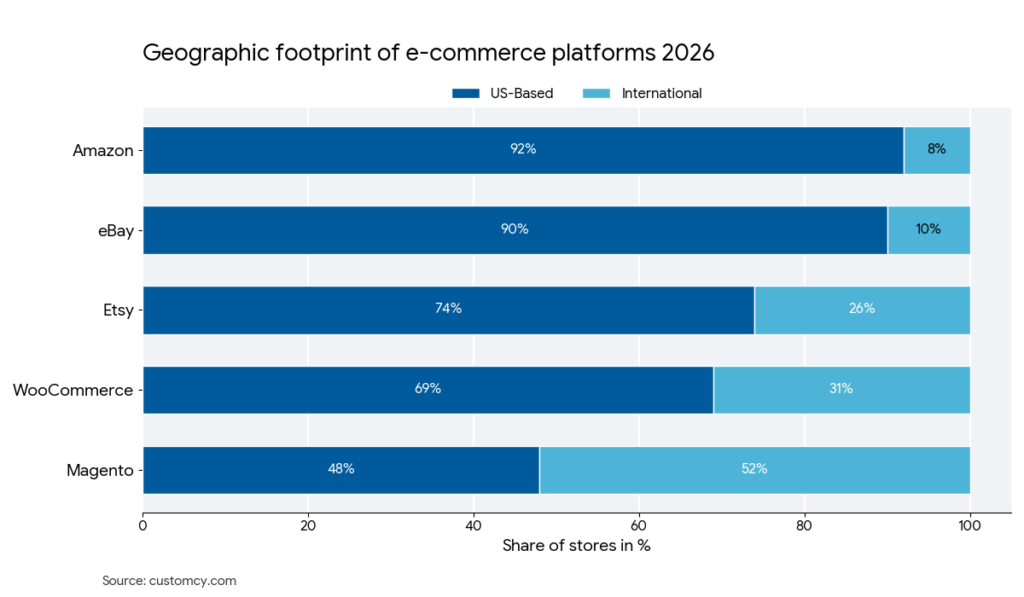
On the other hand, Shopify data confirms US strength with top 100 US stores average $24.2 million monthly revenue, the highest globally. This reflects the largest buyer pool, highest credit card penetration, and most mature logistics infrastructure.
Japan’s Revenue Premium
Japanese Shopify stores average $8.83 million monthly revenue, surprisingly high but below the US. However, ASICS (Japanese based) generates $100M+ monthly revenue on Magento, signaling Japan as a premium market where consumers spend heavily on established brands.
European Fragmentation
UK Shopify stores lead at $2.50 million monthly revenue, followed by Germany ($608K), France ($558K), and Spain ($358K). Language barriers, different payment preferences, complex VAT compliance, and fragmented logistics limit European cohesion. Unlike Asia-Pacific’s concentration, Europe remains divided.
Emerging Markets Growth:
India’s Shopify stores average $1.42 million monthly revenue—outperforming most European regions despite being emerging. Australia shows B2B strength with $100 million monthly revenue on WooCommerce/Magento platforms.
| Region | Top Country | Avg. Revenue | Market Type |
| North America | United States | $24.2M | Mature |
| Asia-Pacific | Japan | $8.83M | Premium |
| Europe | United Kingdom | $2.50M | Fragmented |
| Emerging | India | $1.42M | Growing |
US sellers face maximum competition but largest audience. International sellers should prioritize Etsy for artisan products. Asian expansion is critical for Shopify—Japan’s premium market and India’s growth offer opportunity. European expansion requires country-specific strategies beyond translation. B2B sellers should target developed markets (US, UK, Japan, Germany) where enterprise revenue concentrates.
Top-Earning Categories Across Ecommerce Platforms
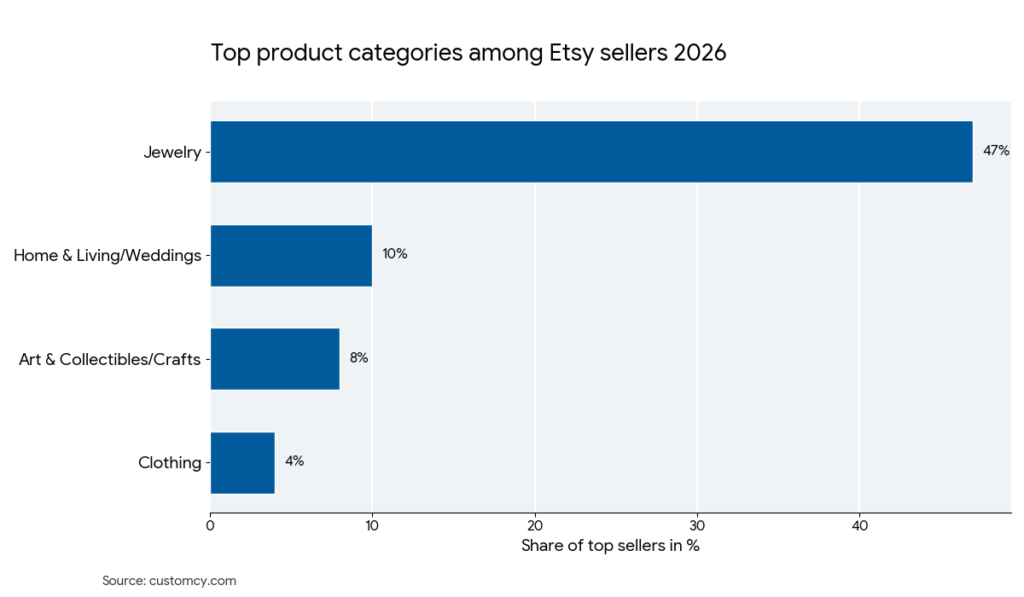
Apparel shows up across every platform, but dominates Shopify, where Shopify apparel sellers average $13.91 million monthly revenue—nearly double the $7.5 million average monthly revenue generated by the top home & garden shopify sellers. Meanwhile, Amazon remains the capital of Health & Supplements, with the niche capturing 36.5% of the platform’s top-tier revenue. Etsy maintains a unique stronghold on Jewelry, which accounts for 60% of its top earners but remains virtually absent from other platform leaderboards.
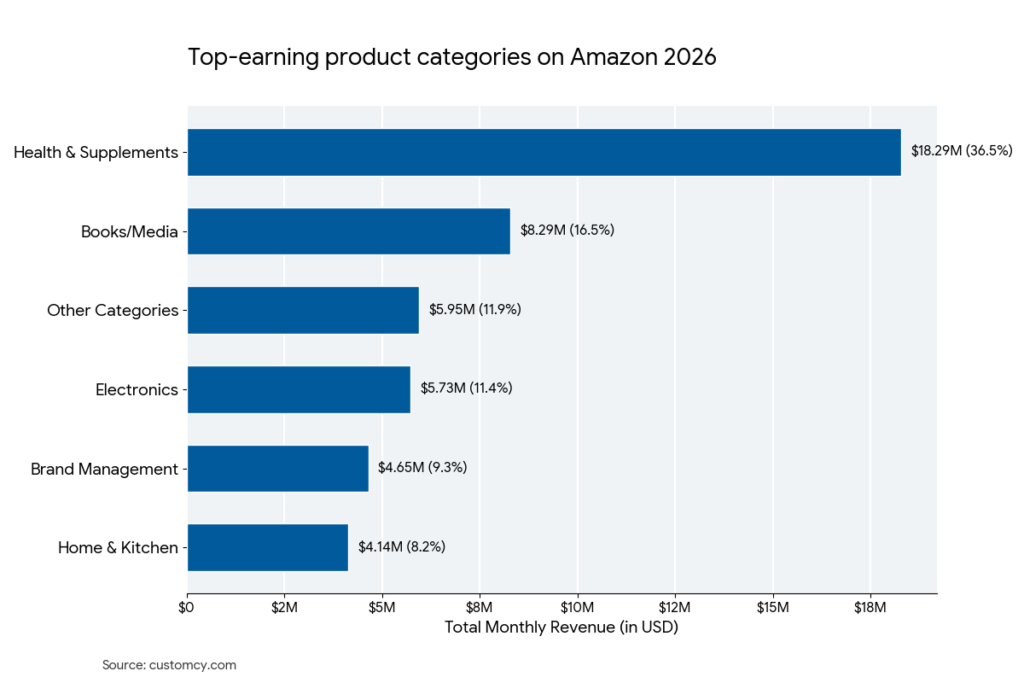
Amazon’s top sellers dominate the health & supplements category at 36.5% of top earner revenue on platform. Carlyle ($8.5M monthly revenue), eSupplements ($3.7M monthly revenue ), and Bayland Health ($3.8M monthly revenue) prove consumable health items with repeat cycles generate extraordinary revenue through high margins and customer loyalty.
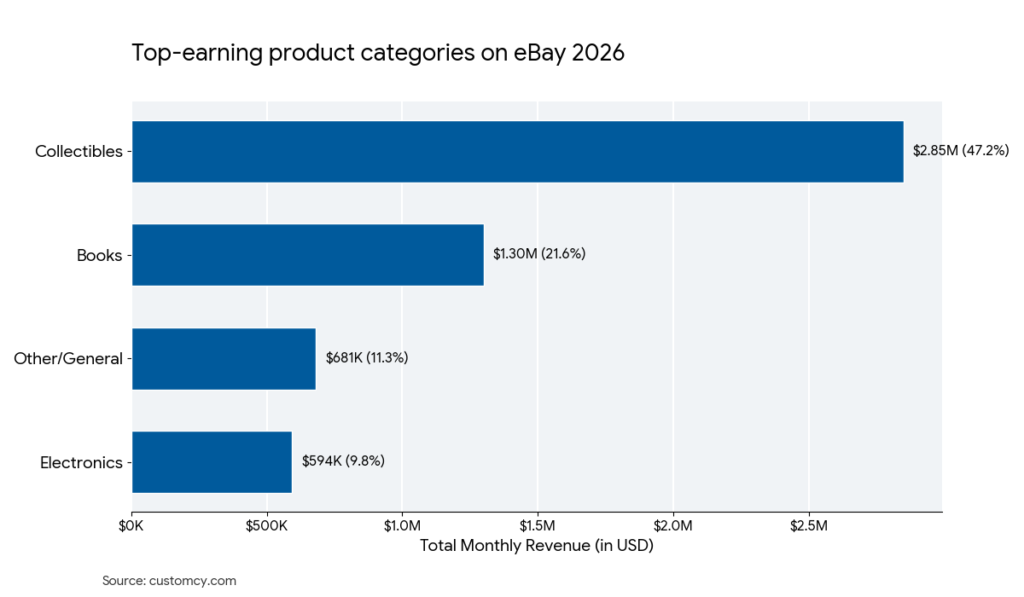
Collectibles at 47.2% of top earner revenue is the dominating category on Ebay. ParkerBrand hits $1.8M monthly through cards and memorabilia, while books capture 21.6% top earner revenue on Ebay. These niches attract passionate buyers willing to pay premiums for curated items.
Etsy’s jewelry dominates with 60% of top earners, generating $791K–$1.2M monthly revenue. Handmade, artisan, and customizable products command premium pricing through personalization.
| Platform | #1 Category (%) | Avg. Revenue | #2 Category | #3 Category |
| Amazon | Health/Supplements (36.5%) | $3.5M+ | Electronics (11.4%) | Home & Kitchen (8.2%) |
| eBay | Collectibles (47.2%) | $1.8M | Books (21.6%) | Electronics (9.8%) |
| Etsy | Jewelry (60%) | $900K | Bath & Beauty | Accessories |
| Shopify | Apparel | $13.91M | Home & Garden | Beauty & Fitness |
Top Amazon Sellers: Revenue Benchmarks
The average monthly revenue for top Amazon sellers is $1.002 million—translating to $12.03+ million yearly. That’s the benchmark for true Amazon dominance.
| Rank | Seller | Category | Monthly Revenue | Avg. Product Price |
| 1 | Carlyle | Supplements | $8,492,266 | $15.42 |
| 2 | Pattern. | Brand Management | $3,647,913 | $53.22 |
| 3 | eSupplements | Supplements | $3,772,319 | $24.71 |
| 4 | Bayland Health | Health (Medical) | $3,848,688 | $18.42 |
| 5 | Utopia Brands | Home & Kitchen | $3,322,832 | $21.42 |
The revenue spread tells the real story. Top earners like Carlyle hit $8.5M monthly, while lower-ranked sellers pull in $248K. That’s a staggering 34x difference, even among the elite.
Top Amazon sellers averaging $1,002,348 monthly revenue generate $150k – $200k monthly profit ($1.80 million – $2.41 million annually) at 15–20% profit margins. These margins reflect platform fees, fulfillment costs, and advertising expenses. Raw profit scale overcomes compressed margins.
Health & Supplements category command 36.5% of top Amazon sellers revenue , proving Amazon’s strength in premium wellness. Books/Media claim the second-largest share at 16.5%, while Clothing represents just 6.1% despite broad accessibility. This reveals Amazon’s true hierarchy: high-AOV health products dramatically outpace commodity items, with electronics and brand management filling the middle tier.
Geography matters more than most realize. A striking 92% of top Amazon sellers are US-based, with Hong Kong and China accounting for just 8%. The US marketplace offers the deepest buyer pool and highest purchase power.
Product pricing varies by category, ranging from $15–$102 average per item. But the top earners aren’t relying on premium pricing—they’re moving volume at $15–$25 price points.
Amazon top sellers revenue-to-feedback ratio average is $610. Carlyle (in the Supplements niche) generates $189 per review. On the other hand, Woot (Electronics) generates $1176 per review. Same platform, different category.
Top eBay Sellers: Revenue Benchmarks
The average monthly revenue for top eBay sellers is $125,123—translating to $1.5 million yearly. That’s the baseline for eBay dominance.
| Rank | Seller | Category | Monthly Revenue | Avg. Product Price |
| 1 | ParkerBrand | Collectibles | $1,796,009 | $434.06 |
| 2 | The Reel Market | Collectibles | $730,079 | $154.58 |
| 3 | OnTimeBooks | Books | $768,616 | $30.13 |
| 4 | Moderntek | Electronics | $478,450 | $217.43 |
| 5 | Texas Jewelers LLC | Jewelry | $256,693 | $341.65 |
The revenue gap is massive. ParkerBrand dominates with $1.8M monthly, while sellers ranked lower pull in just $4K–$50K. That’s over a 400x difference, even among eBay’s elite performers.
Top Ebay sellers generated $15K–$22.5K monthly profit ($180K–$270K annually) at 12–18% profit margins. ParkerBrand at $1.79M monthly retains $215K–$322K monthly profit—demonstrating collectibles’ efficiency through minimal fulfillment requirements. Category positioning drives margin variations.
Collectibles at 47.2% of top earner revenue is the dominating category on Ebay with $2.85 million monthly revenue. ParkerBrand alone captures $1.79M revenue through cards, coins, and memorabilia.
Books command 21.6% top earner revenue with $1.30 million revenue, proving eBay’s strength in niche specialization. Electronics contribute 9.8%, while Jewelry, Automotive, and other categories complete the ecosystem. Unlike Amazon’s health dominance, eBay succeeds through community-driven collectibles and specialty items.
Average product prices tell the real story. eBay sellers operate in two worlds: high-ticket collectibles averaging $300–$434 per product, and volume-based sellers averaging $15–$30 per product. Your business model determines your revenue ceiling.
eBay sellers revenue-to-feedback ratio average is $143.65 lower than amazon. OnTimeBooks generates $48.3 per feedback; ParkerBrand hits $2091 per feedback. This 43x difference reveals eBay’s core challenge: category matters more than platform. Books operate on thin margins requiring massive feedback volume to scale revenue, while collectibles generate premium pricing per transaction.
The profitability equation is different here. Unlike Amazon’s lower price points, eBay rewards sellers who specialize in niche, collectible, or high-ticket items. Your audience is more targeted. Your margins are higher. Your volume is lower but your revenue per transaction is substantially greater.
Top Etsy Sellers: Revenue Benchmarks
The average monthly revenue for top Etsy sellers is $174,488—translating to $2.09+ million yearly. That’s the threshold for reaching Etsy’s highest tier of success.
| Rank | Seller | Location | Monthly Revenue | Shop Age |
| 1 | AMJEWELRY NYC | New York, United States | $1,202,026 | 4 years |
| 2 | AGIOTA | Kyiv, Ukraine | $1,145,890 | 7 years |
| 3 | OliviaVdesigns | New York, United States | $1,119,956 | 7 years |
| 4 | SquatchyShop | California, United States | $1,062,671 | 9 years |
| 5 | DeKaraDesigns | California, United States | $791,092 | 12 years |
The revenue spread reveals opportunity. AMJEWELRY NYC hits $1.2M monthly, while sellers ranked 49th earn $175K. That’s a 7x gap—far smaller than Amazon or eBay, suggesting the playing field is more level on Etsy.
Top Etsy sellers averaging $174,488 monthly revenue generate $43.6K–$61K monthly profit ($523K–$732K annually) at 25–35% profit margins. No fulfillment costs (ship direct), low customer acquisition (platform discoverability), and premium positioning enable higher margins. This profitability sustains single-founder businesses without team overhead.
The jewelry category dominates the Etsy platform. Nearly 60% of top Etsy sellers operate in jewelry, with monthly revenues exceeding $700K–$1.2M. Bath & Beauty, Accessories, and Art & Collectibles follow, but jewelry’s combination of high margins and passionate buyers makes it the clear winner.
The United States leads the geographic race on Etsy. 74% of top Etsy sellers are US based. The California state hosts the most top Etsy sellers, but international shops punch above their weight. Ukraine, Italy, Poland, and Canada all have top-10 earners, proving Etsy’s truly global marketplace rewards quality over geography.
Shop age tells a surprising story. Top earners range from 4-year-old shops (AMJEWELRY NYC at $1.2M) to 19-year veterans. This means Etsy success isn’t about longevity—it’s about quality products, smart marketing, and customer loyalty. New shops can scale fast.
The data reveals a stunning correlation: jewelry sellers with high average product price dominate revenue rankings. Top earner AGIOTAGE at $1.14M monthly has a $1,942 average product price. DIAMONDFORLOVE generates $493K monthly on $1,084 average product price . Even mid-tier jewelry sellers with $500–$1,500 average product price hit $200K–$800K monthly.
The Etsy advantage is personalization. Unlike Amazon’s algorithm-driven marketplace or eBay’s auction model, Etsy rewards craftsmanship, brand story, and design distinctiveness. Etsy sellers typically maintain higher average product prices than general e-commerce because buyers pay for originality, customization, and the maker’s story. This creates a different profit equation—lower volume, higher margins, sustainable growth.
Top Shopify Sellers: Revenue Benchmarks
The average monthly revenue for top Shopify sellers is $33.03 million—translating to $396.3+ million yearly. That’s the revenue tier of multinational enterprises operating on a single platform.
| Rank | Brand | Category | Monthly Revenue | Platform |
| 1 | Herman Miller | Home & Garden | $821,700,000 | Shopify Plus |
| 2 | Peloton | Sports | $247,866,667 | Shopify Plus |
| 3 | waterdrop® US | Health | $228,826,000 | Shopify Plus |
| 4 | Steve Madden | Apparel | $184,244,000 | Shopify Plus |
| 5 | Arhaus | Home & Garden | $108,743,000 | Shopify Plus |
The revenue disparity is staggering. Herman Miller generates $821.7M monthly, while sellers ranked 100th pull in $9.7M. That’s an 85x difference, reflecting the massive gap between industry giants and emerging growth brands.
Top Shopify sellers generate $3.3M–$9.9M monthly profit ($39.6M–$118.8M annually) at 10–30% profit margins, depending on the operational model. Organic-focused sellers (email, content, social) hit upper-range margins; heavy paid-ad operators drop toward lower-range.
Shopify Plus is the de facto standard. 95% of top earners use Shopify Plus, the enterprise-grade platform offering advanced customization, dedicated support, and scalability. Regular Shopify hosts emerging brands still climbing the revenue ladder.
Shopify by Region: Which Markets Are Actually Winning?
Shopify’s global footprint is massive, but revenue performance varies wildly by region.
We analyzed the top 100 Shopify stores in each of 10 regions to reveal where average monthly revenue is highest. The gap between highest and lowest performing markets is staggering.
The United States dominates decisively. The top 100 Shopify stores in the US average $24.2 million monthly—nearly 3x the Japan average and 10x the UK average. This reflects America’s massive addressable market, mature e-commerce infrastructure, and dominant brand ecosystem creating ideal Shopify conditions.
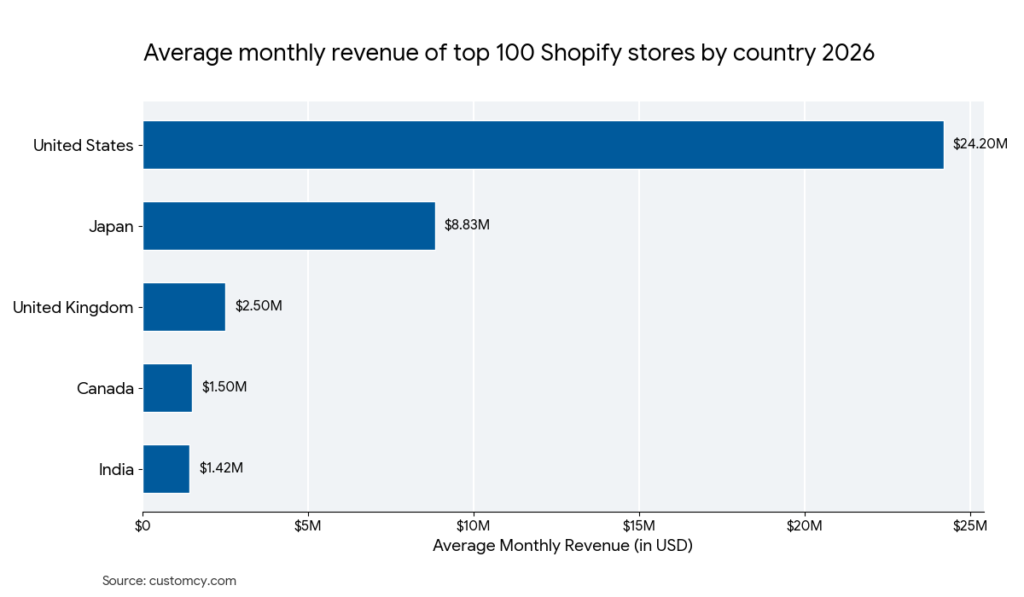
Japan ranks second strongest. The top 100 Shopify stores in Japan average $8.83 million monthly—a premium performance reflecting Japan’s affluent, tech-forward consumer base and high average product prices.
The UK leads smaller mature markets. Top 100 UK stores average $2.50M monthly. Canada’s top 100 stores follow at $1.50M, showing consistent but lower North American performance outside the US.
India’s top 100 stores outperform most European nations. At $1.42M average monthly, India signals explosive growth potential as middle-class expansion and digital payments infrastructure mature.
European fragmentation is real. Germany’s top 100 stores lead at $608K, followed by France at $558K. Italy, Netherlands, and Spain range from $358K–$433K. Mature but fragmented, European markets show lower average store revenue than English-speaking countries.
Hong Kong’s top 100 stores show emerging strength at $533K monthly—outperforming most European regions despite smaller population, reflecting Asia-Pacific’s growing e-commerce appetite.
Shopify by Category: Where Top Stores Make Real Money
Not all Shopify categories are created equal. The revenue gap between winners and losers is massive.
We analyzed the top Shopify stores across 14 major categories to reveal which niches generate the highest revenue. The results show clear winners—and several struggling segments.
Apparel is the undisputed heavyweight champion. Top 100 apparel stores average $13.91 million monthly—more than 10x higher than games and gifts categories. Fashion’s combination of high volume, seasonal trends, and strong brand loyalty creates the perfect revenue machine on Shopify.
Home & Garden and lifestyle dominate the premium tier. Home & Garden reaches average $7.50M monthly, while Beauty & Fitness hits $6.83M. These categories benefit from higher average product prices, repeat purchases, and strong customer engagement. Sports follows at average $6.08M monthly, proving that niche athletic markets generate serious revenue.
Health and wellness reach five figures monthly. At $5.25M average monthly revenue, health products prove that consumers prioritize wellness spending even in economic downturns. Food & Drink follows at $4.17M average monthly revenue, showing strong demand for premium groceries and specialty beverages.
The middle tier shows opportunity. Electronics ($2.25M), Autos & Vehicles ($2.08M), and Pets & Animals ($1.83M) offer solid revenue potential. These categories aren’t flashy, but top 100 stores generate consistent seven-figure monthly revenue.
The bottom tier reveals saturation. Games, Gifts & Special Events, Arts & Entertainment, and Business & Industrial all hover average $1.33–$1.50M monthly. These categories are either oversaturated, low-margin, or require niche positioning to succeed.
Strategic category selection matters enormously. Entering an oversaturated low-revenue category like games requires exceptional differentiation. Conversely, Food & Drink and Health offer solid revenue potential with less saturation than apparel.
Top WooCommerce Sellers: Revenue Benchmarks
The average monthly revenue for top WooCommerce sellers is $315,020,000—translating to $3.78+ billion yearly. That’s the revenue tier of Fortune 500 multinational enterprises running complex, mission-critical commerce operations.
| Rank | Website | Country | Monthly Revenue | Tech Spend | Employees |
| 2 | learning.intertek.com | Cyprus | $100,000,000+ | $64,829+ | 44,000+ |
| 3 | companystore.pluralsight.com | Ireland | $391,864,992+ | $63,372+ | 2,158+ |
| 4 | supplies.tyro.com | United States | $100,000,000+ | $56,427+ | 450+ |
| 5 | store-eu.dometic.com | United States | $100,000,000+ | $52,113+ | 6,700+ |
The revenue floor is staggering. Even lower-ranked sellers on WooCommerce are hitting $100M+ in monthly revenue. These aren’t startups—they’re global corporations managing enterprise-scale operations on a self-hosted platform.
Woocommerce sellers generate $56.7M–$81.9M monthly profit ($680M–$983M annually) at 18–26% profit margins. Higher margins than pure enterprise platforms because B2B models have better leverage. Still requires massive infrastructure investment but yields strong absolute profit.
Tech investment separates the winners. Top earners spend $50K–$99K+ monthly on technology infrastructure, development, and operations. This isn’t a hobby platform. It requires engineering teams, infrastructure scaling, and continuous optimization to handle billions in annual transactions.
Geographic diversity runs deep. These sellers span Japan, Cyprus, Ireland, Australia, Germany, the Netherlands, Switzerland, and the Philippines. WooCommerce’s open-source foundation makes it the global standard for companies unwilling to depend on single-platform providers.
Top Magento Sellers: Revenue Benchmarks
The average monthly revenue for top Magento sellers is $400,770,000—translating to $4.8+ billion yearly. That’s the revenue tier of Fortune 500 multinational enterprises managing global commerce at unprecedented scale.
| Rank | Website | Country | Monthly Revenue | Tech Spend | Employees |
| 1 | asics.com | Japan | $100,000,000+ | $99,717+ | 9,500+ |
| 2 | corporategifts.1800flowers.com | United States | $2,017,853,056+ | $35,856+ | 2,837+ |
| 3 | partnerportal.flir.com | United Kingdom | $1,923,688,960+ | $61,211+ | 3,586+ |
| 4 | store.quakerhoughton.com | United States | $1,943,585,024+ | $19,940+ | 2,464+ |
| 5 | adtran.com | United States | $1,025,536,000+ | $38,934+ | 1,655+ |
Fortune 500 dominance defines Magento. These aren’t scrappy startups—they’re ASICS, LG, Elsevier, Dyson, Philips, and Scania. Global brands managing $100M–$2B+ monthly revenue depend entirely on Magento’s enterprise capabilities.
Magento sellers generate $48.1M–$88.2M monthly profit ($577M–$1.06B annually) at 12–22% profit margins. Lower margins reflect massive operational overhead
Tech investment reaches Fortune 500 levels. Top earners spend $35K–$99K+ monthly on technology infrastructure, development teams, and platform optimization. Some sellers invest over $60K monthly solely on tech operations—equivalent to hiring multiple senior engineers.
Geographic reach spans continents. Magento powers commerce across Japan, United States, United Kingdom, Australia, Sweden, France, Germany, Austria, New Zealand, and the Philippines. These sellers manage multi-currency, multi-language, and multi-jurisdiction operations simultaneously.
Conclusion
I hope you found this analysis interesting.
I’d like to thank BuiltWith, Marketplace Pulse and Clipara for providing the data for this study.
For those that are interested, here is a PDF of our study methods. And a link to a file with all of the raw data.