
This is a complete list of up-to-date Leather Industry statistics for 2026. On this page, you’ll find hand-picked stats.
So, without further ado, let’s see the stats!
Top Leather Industry Statistics (Editor’s Picks)
- The global leather goods market was $531.07 billion in 2025 and projected to grow to $855.36 billion by 2032.
- Asia-Pacific was the largest regional market, holding 39.87% of global leather goods revenue in 2024.
- Luggage (suitcases, briefcases, business cases) is the industry’s top-performing product segment and takes around 43% of industry revenue.
- Footwear was the second largest product segment, accounting for 39.25% of total leather goods revenue in 2024.
- By 2029, global luxury leather goods users are projected to reach 397.2 million, with a user penetration rate of 5.4%.
- Global per-person spending on luxury leather goods in 2025 is about $8.45.
- In 2025, the average revenue per user (ARPU) of luxury leather goods is projected at $48.21.
- Global raw hide production was approximately 21 million metric tons in 2023, with cattle hides ≈ 60% of the total.
- In the U.S. alone, about 4.8 million hides ended up in landfills, making up 15% of the country’s total production.
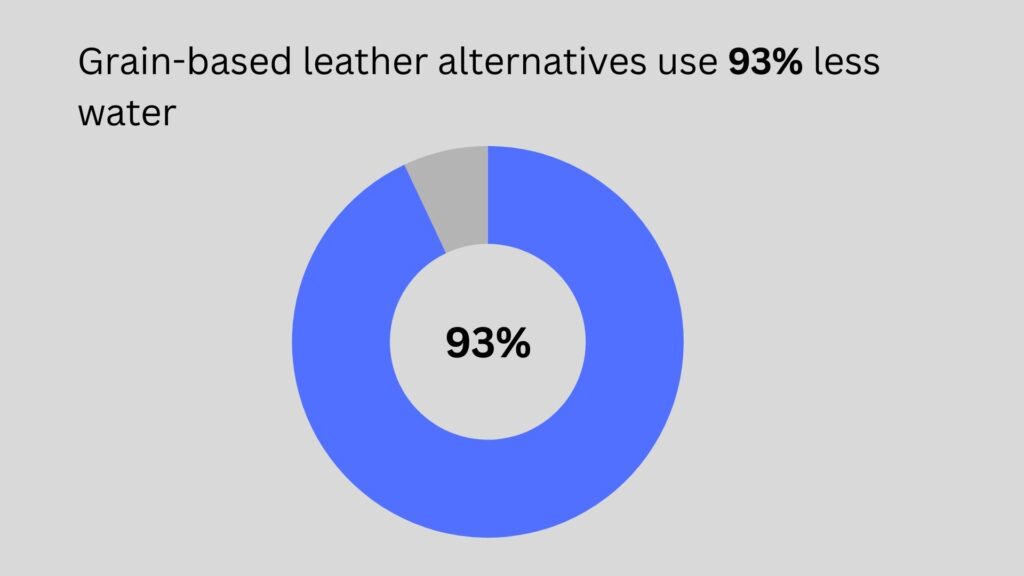
- Grain-based leather alternatives use 95% less greenhouse gas, 93% less water, and 72% less energy than traditional leather.
- The carbon footprint of cowhide leather is 110 kg CO₂e per square meter, making it nearly seven times higher than that of synthetic leather.
Market Size & Growth
- The global leather goods market is $531.07 billion in 2025 and projected to grow $855.36 billion by 2032, at a 7.05% CAGR.
- In 2024, Europe held the second-largest share of the leather goods market at 37.44%, driven by strong demand for luxury items.
- Asia-Pacific region held 39.87% of the global revenue leather goods market..
- The footwear segment accounted for 39.25% of the total leather goods market revenue in 2024.
- The global leather footwear market was $138.29 billion in 2024 and is expected to reach $166.28 billion by 2030.
- The leather clothing market was valued at about $35.6 billion in 2023 and is projected to reach $51.8 billion by 2032. Leather jackets ranked top in the clothing market.
- Global revenue from luxury leather goods is estimated at $66.03 billion in 2025, with a 2.20% CAGR from 2025 to 2030.
- In 2025, the United States generated about $13 billion in luxury leather goods revenue.
- Global per-person spending on luxury leather goods in 2025 is about $8.45.
From 2018 to 2024, average per-person revenue rose by $1.71. From 2024 to 2030 forecasted rise per person revenue is $0.52.
Luxury Leather Goods Statistics
- By 2029, the number of luxury leather goods worldwide is expected to reach 397.2 million.
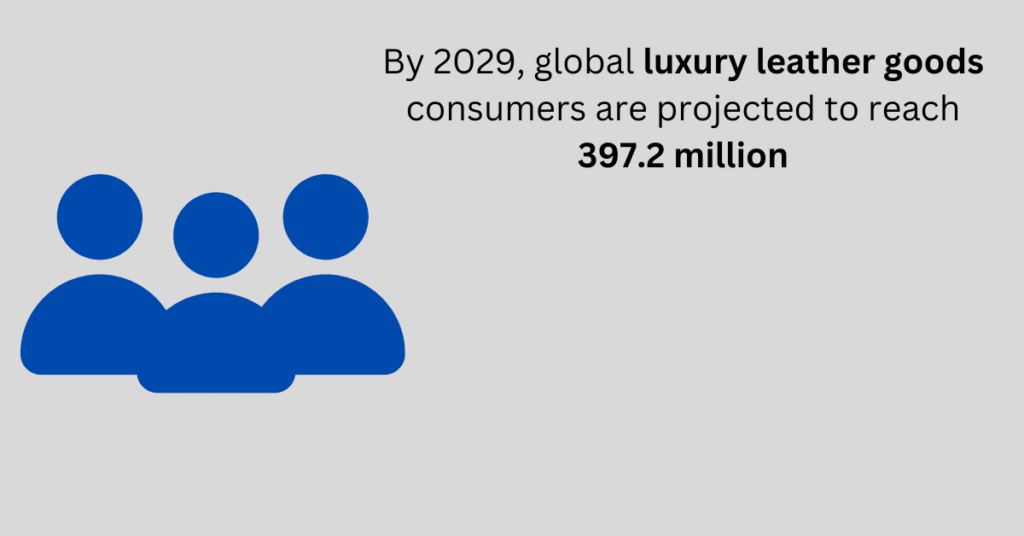
- Luxury leather goods user penetration will rise from 4.7% in 2025 to 5.4% by 2029.
- The average revenue per user of luxury leather goods (ARPU) is projected at $48.21 in 2025.
- The luxury leather handbags market is valued at $29.02 billion in 2025.
- In 2025, the luxury leather handbags market in the United States will generate about $6 billion in revenue, the highest worldwide.
- On a per-person basis, average revenue in the luxury leather handbags market is $3.71 in 2025.
- The luxury leather wallets & little cases market is valued at $9.65 billion in 2025.
- The luxury leather wallets & little cases market is projected to grow at a 2.03% CAGR between 2025 and 2030.
- In 2025, the luxury leather wallets & little cases market in the United States will generate about $2 billion in revenue, the highest globally.
- On a per-person basis, the luxury leather suitcases & briefcases market average revenue is $1.24 in 2025.
- The luxury leather wallets & little cases market is valued at $12.71 billion in 2025.
- The luxury leather suitcases & briefcases market is projected to grow at a 2.75% CAGR between 2025 and 2030.
- In 2025, the luxury leather suitcases & briefcases market in the United States will generate about $2 billion in revenue, the highest globally.
- On a per-person basis, the luxury leather suitcases & briefcases market average revenue is $1.63 in 2025.
- The secondhand luxury leather goods market (bags, purses, belts) was $2.8 billion in 2023 and is projected to reach $3.8 billion by 2028 with a CAGR of 12.8%.
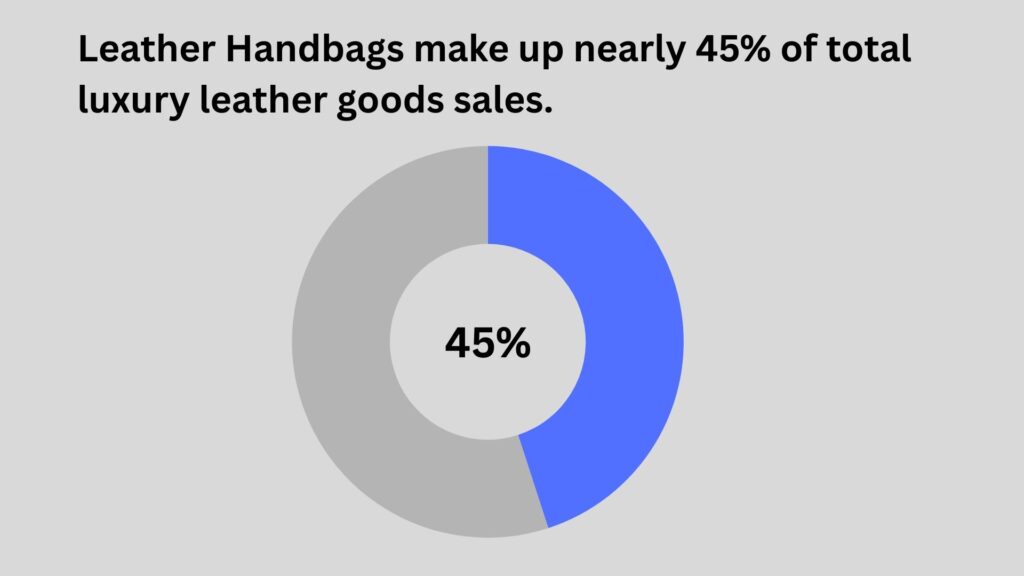
- Handbags make up nearly 45% of total luxury leather goods sales.
- The global luxury leather handbag market is projected to grow by over $3 billion between 2025 and 2030, reaching $32.5 billion in 2030.
Sources: Fortune Business Insights, Mordor Intelligence, Grand View Research, DataIntelo, Statista, Global Growth Insights, Statista, Statista, Statista, Statista
Product Segments & Leading Categories
- Luggage (suitcases, briefcases, business cases) is the industry’s top-performing product segment and takes around 43% of industry revenue.
- The luxury leather suitcases & briefcases market is valued at $12.71 billion in 2025. The United States estimated revenue is 2 billion in 2025 from this market.
- Footwear is the second largest sub-category of the leather goods market with 39.25% share.
- Handbags, suitcases/briefcases, wallets, and small leather goods together form the main luxury product mix; small leather goods are more popular among younger consumers.
Sources: IBISWorld, Mordor Intelligence
E-commerce & Digital Adoption
- By 2025, it is estimated that 19% of personal luxury sales will happen online (more than triple the 2009 levels).
- Nearly 80% of personal luxury sales are “digitally influenced.”
- Worldwide online shoe sales were about $113.0 billion in 2023.
- Online sales accounted for roughly 31.2% of global footwear sales in 2023.
- About 63% of consumers planned to shop online for shoes during the 2023 holiday season.
- In 2021, leather shoes bought online had a market share of 70%, generating about $69.37 billion in sales.
- For luxury leather goods, online retail now accounts for over 35% of total sales, and e-commerce transactions rose 40% in five years (North America +50%, Asia-Pacific +60%).
- While e-commerce and digital channels are expanding rapidly, offline retail still dominated leather goods sales in 2024, accounting for 71.23% of the market.
- Online retail is projected to accelerate at a 9.24% CAGR through 2030.
- The online segment of the leather footwear market is projected to grow at a 3.5% CAGR.
Sources: McKinsey, RunRepeat, Global Growth Insights, Mordor Intelligence, Grand View Research, market.us.
Second Hand Market
- The secondhand luxury leather goods market (bags, purses, belts) was worth $2.8 billion in 2023.
- The pre-owned market is projected to reach $3.8 billion by 2028 at a CAGR of 12.8%.
- Asia led with approximately $822.5 million and Europe with $623 million in the regional split for the secondhand market..
Sources: Statista
Consumer Perception toward Leather & Alternatives
- 92% of U.S. consumers reported being at least somewhat open to purchasing next-gen (animal-free) materials.
- 51% of consumers were somewhat to moderately likely to purchase next-gen materials.
- 41% of consumers were very likely to purchase next-gen materials — a clear early-adopter segment.
- 94.8% of consumers correctly recognized that the tanning process requires a lot of water.
- 21.9% of consumers knew that German manufacturers/retailers are legally required to know the chemicals contained in leather.
- 26.9% of consumers correctly identified the statement “genuine leather is always without plastic components” as false.
Sources: Material Innovation Initiative, Frontiers in Sustainability
Production, Hides & Tanneries
- Global raw hide production was approximately 21 million metric tons in 2023, with cattle hides ≈ 60% of the total.
- In 2024, China consumed about 27% of global raw hide volume and accounted for 47% of global raw cattle hide imports.
- Brazil’s hides and skins exports grew 12.5% in value and 22.3% in square meters in 2024 versus 2023.
- In 2020, approximately 120 million hides were wasted globally, accounting for nearly 40% of worldwide hide production.
- In the U.S. alone, about 4.8 million hides ended up in landfills, making up 15% of the country’s total production.
- Rising global footwear production contributed to a 56% increase in demand for tanned leather over the past three years.
Sources: Global Market Insights, IndexBox, APLF, Choose Real Leather. Business Research Insights
Supply Chain, Trade & Prices
- Global leather shoe exports were about $63.0 billion in 2023 (up 3.4% vs 2022).
- Europe exported $32.4 billion (51.4%) and Asia exported $28.0 billion (44.4%) of leather shoes in 2023.
Top Leather Shoe Exporting Regions
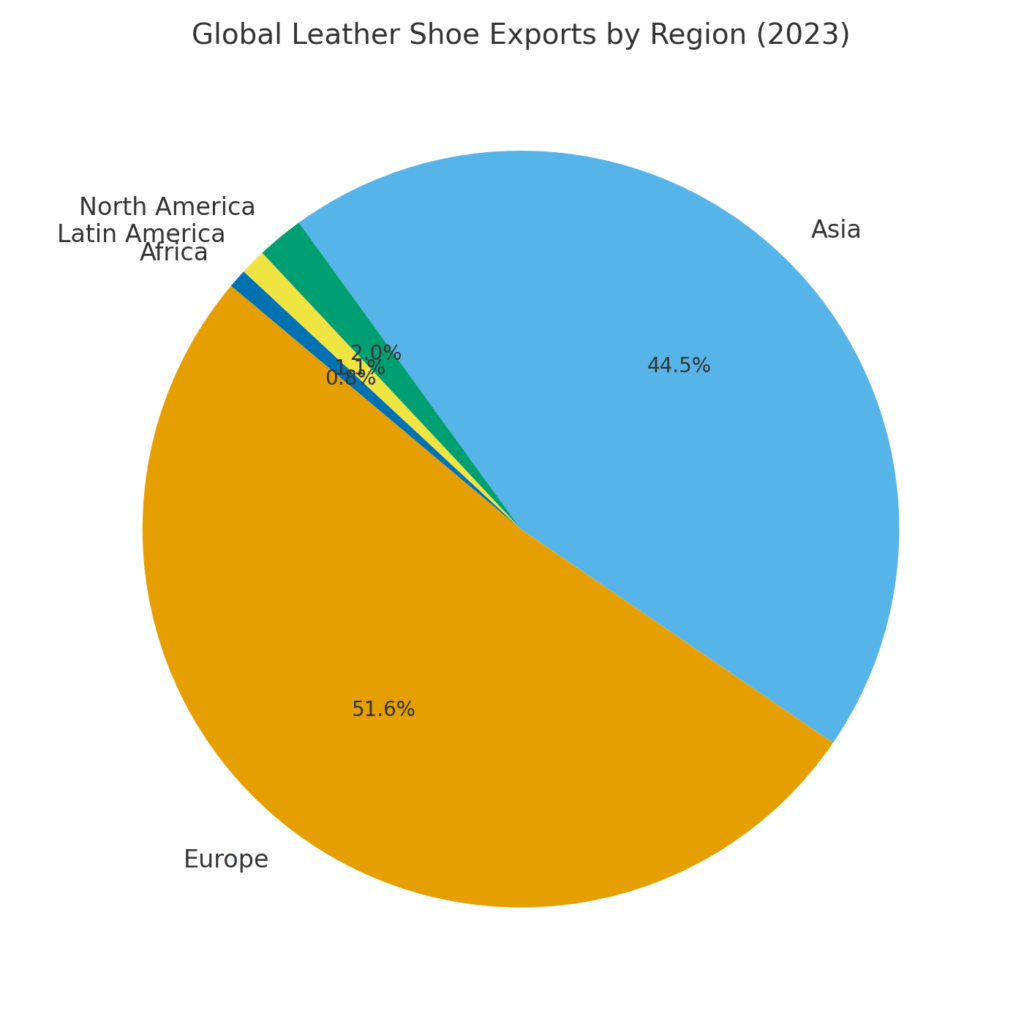
| Region | Share of Global Sales |
| Europe | 51.40% |
| Asia | 44.40% |
| North America | 2.00% |
| Latin America | 1.10% |
| Africa | 0.80% |
| Oceania | 0.10% |
- Top leather shoe exporters in 2023: Vietnam $10.6B; Italy $8.9B; China $8.5B.
Top Leather Shoe Exporting Countries
| Country | Export Value (USD) | Global Share |
| Vietnam | $10.6 billion | 16.70% |
| Italy | $8.9 billion | 14.20% |
| China | $8.5 billion | 13.50% |
| Germany | $4.8 billion | 7.60% |
| Belgium | $3.5 billion | 5.60% |
| Indonesia | $3.0 billion | 4.70% |
| France | $2.9 billion | 4.70% |
| Netherlands | $2.5 billion | 3.90% |
| India | $1.8 billion | 2.90% |
| Portugal | $1.72 billion | 2.70% |
| Spain | $1.67 billion | 2.70% |
| Poland | $1.4 billion | 2.20% |
| Hong Kong | $969 million | 1.50% |
| Bangladesh | $772.1 million | 1.20% |
| Mexico | $750 million | 1.20% |
- The U.S. imported about $169.8 million of finished leather goods in 2023, mainly from Mexico, India, and China.
- In 2022, the U.S. was the top leather shoe importer with 20% of the global import value.
- Germany was the second largest shoe importer with just under 10% global import value..
- Italy led global exports of leather apparel with $1.29 billion in 2023, followed by China at $1.14 billion and India at $848 million.
Top Leather Apparel Exporters
| Country | Export Value (2023) |
| Italy | $1.29 billion |
| China | $1.14 billion |
| India | $848 million |
- The United States led global imports of leather apparel with $1.37 billion in 2023, followed by Germany at $544 million and France at $512 million.
Top Leather Apparel Importers
| Country | Import Value (2023) |
| United States | $1.37 billion |
| Germany | $544 million |
| France | $512 million |
Global Imports: Leather apparel and clothing accessories
- The estimated value of global imports of leather apparel and clothing accessories was $7,302,236 in 2024.
| Importers | Imported value |
| World | 7,302,236 |
| United States of America | 1,436,411 |
| Germany | 543,277 |
| France | 520,591 |
| Italy | 408,259 |
| China | 348,794 |
| Japan | 297,082 |
| Netherlands | 270,800 |
| United Kingdom | 248,321 |
| Korea, Republic of | 224,755 |
| Spain | 217,363 |
| Canada | 205,512 |
- Brazil was the top exporter of leather and exported $1.2 billion worth of leather in 2024.
- The United States was the second biggest leather exporter with $617 million worth of leather in 2024.
Sources: Tendata, World Bank WITS, Statista (exporters), OEC, IndexBox, Trade Map
Sustainability & Alternative Materials
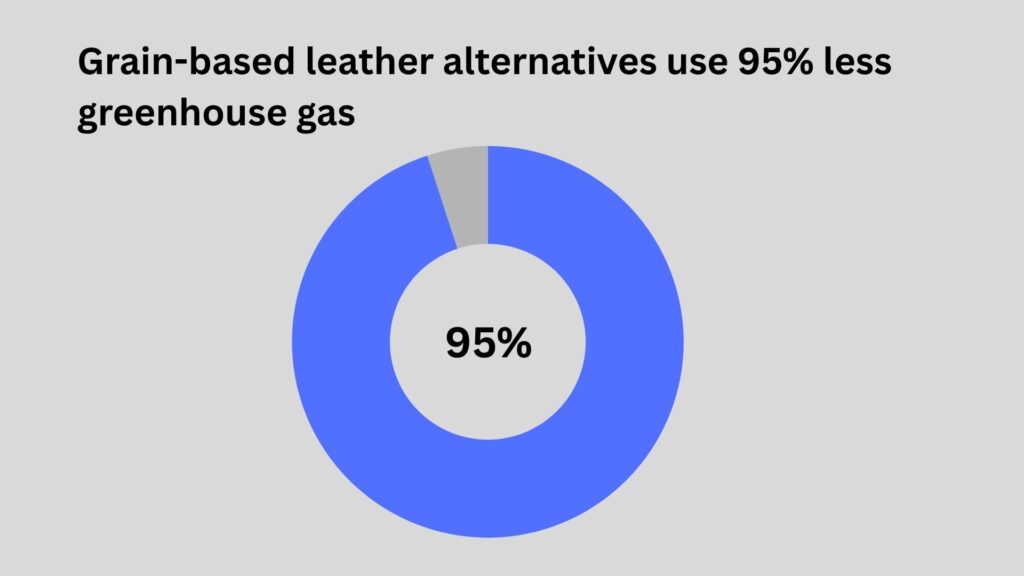
- Grain-based leather alternatives use 95% less greenhouse gas, 93% less water, and 72% less energy than traditional leather.
- The carbon footprint of cowhide leather is 110.0 kg CO₂e per square meter, making it nearly seven times higher than that of synthetic leather, which stands at 15.8 kg CO₂e per square meter.
- Plastic/synthetic leather currently makes up about 15–20% of the leather goods market.
- Producing 1 m² of finished leather results in about 22.48 kg CO₂e.
- About 68% of leather’s environmental impact is linked to farming and slaughter stages.
- The bio-based leather market was $145.26 million in 2024, projected to reach $535.69 million by 2034 (CAGR ~13.94%).
- A single pair of leather shoes may use about 2,113 gallons of water.
- The vegan leather market was estimated at $11.07 billion in 2025.
Environmental Effects of Cattle Ranching & Waste
- In Brazil’s Amazon, cattle ranching for beef and leather drove about 80% of deforestation.
- In Queensland, Australia, cattle farming caused about 93% of deforestation in local rainforest areas.
- Raising cattle uses about 17,100 liters of water per kg of leather at the farm stage (draft citation).
Sources: CarbonFact, Collective Fashion Justice, Precedence Research, Custom Market Insights, Vegconomist, Global Market Insights, Collective Fashion Justice, Circumfauna, IFAS, Choose Real Leather.
Employment, Wages & Safety (U.S. highlights)
- In 2024, the median annual wage in leather and allied product manufacturing was $35,160, with hourly wages averaging $17.
- In 2024, the leather and allied product manufacturing industry employed 11,400 workers across key occupations.
Employment by Occupation
| Data series | Employment,2024 |
| First-line supervisors/managers of production and operating workers | 1,100 |
| Inspectors, testers, sorters, samplers, and weighers | 410 |
| Sewing machine operators | 1,880 |
| Shoe and leather workers and repairers | 5,710 |
| Team assemblers | 2,300 |
- In 2024, labor productivity in leather and allied product manufacturing grew by 2.1%.
- The number of private leather manufacturing establishments in the U.S. was 1,574 in the fourth quarter of 2024.
- In June 2025, the Producer Price Index (PPI) for leather and allied product manufacturing in the US was 206.84.
- In 2023, the rate of total recordable workplace injuries and illnesses in the U.S.leather and allied product manufacturing was 3.4 cases per 100 full-time workers.
Sources: U.S. Bureau of Labor Statistics
Investment, Innovation & Outlook
- Investment in eco-friendly tanning technologies increased by 36% in recent years.
- Bio-based tanning adoption increased 43% and chrome-free alternatives rose 38%.
- Faircraft raised about $16 million, and UNCAGED raised $5.6 million (seed, 2024) in funding rounds.
- Accessories grew 2–4% and leather goods grew 3–4% in recent industry commentary; growth has slowed but remains positive.
Sources: Business Research Insights, Fashion Dive, ESG Today