
Private label (store brand) products – those made by one company and sold under another’s brand – are surging in e-commerce. This article compiles recent private label statistics. We cover global and U.S. market sizes, growth rates, consumer adoption, seller strategies, and platform-specific metrics.
Top Private Label Stats (Editor’s Picks)
- The global private-label market was $915.1 billion in 2024 and is forecast to reach $1,623.4 billion by 2034.
- The US private label market is a large and rapidly growing sector, with sales reaching $271 billion in 2024. This represents a 3.9% increase compared to 2023.
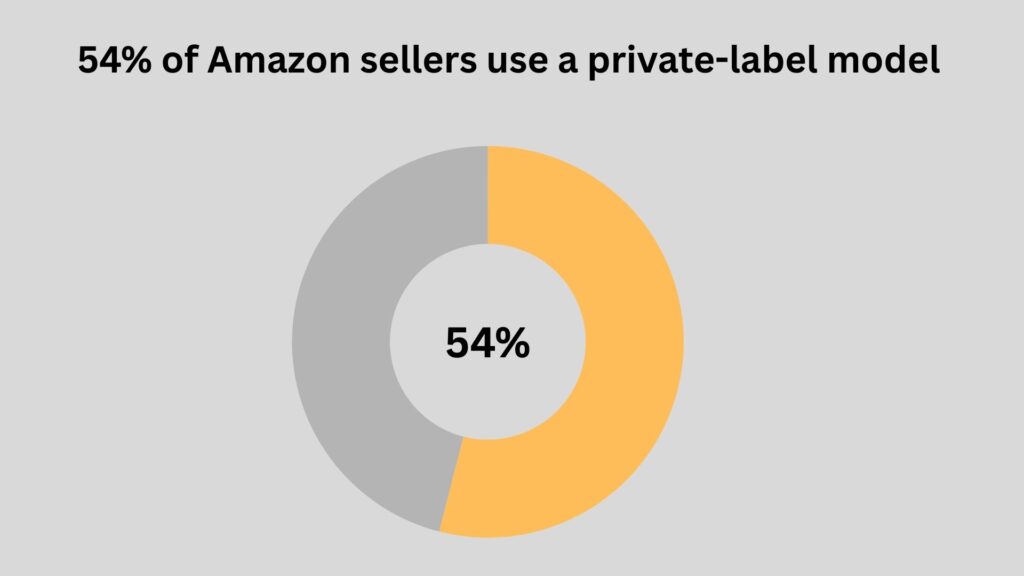
- On Amazon, 54% of sellers use a private-label model, making it the most common seller strategy.
- Europe remains the most mature private-label region by share and scale with 39% (≈$412 billion in 2024) share.
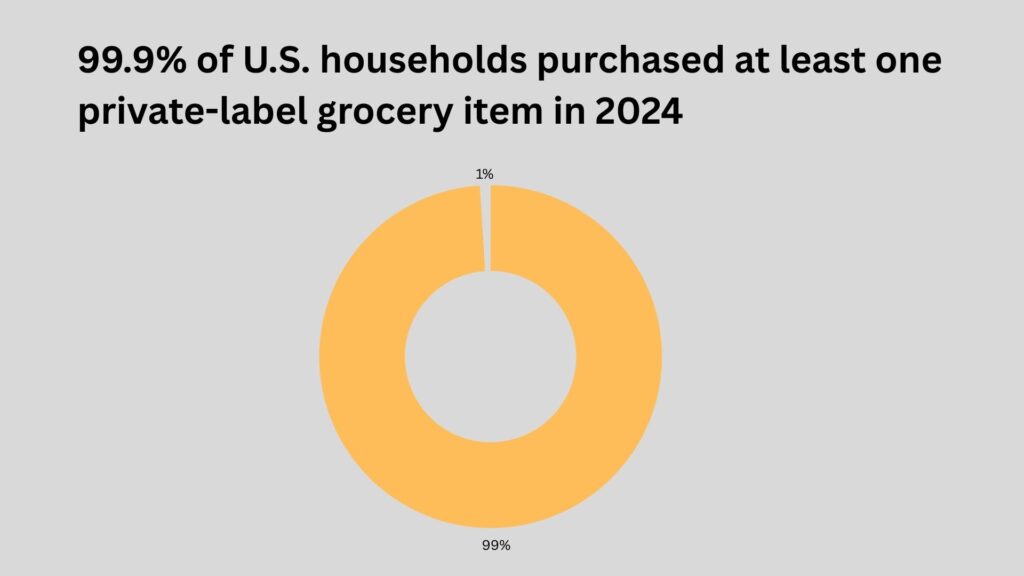
- U.S. grocery household penetration for private label reached 99.9% in 2024.
- 71% of Gen Z consumers say they sometimes or always buy cheaper versions of name-brand products.
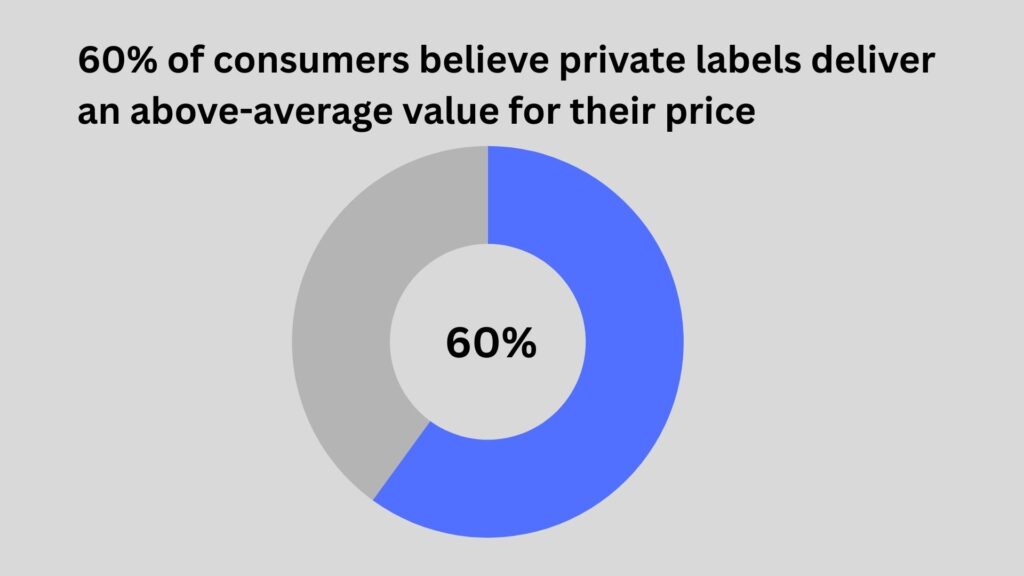
- 60% of consumers believe private labels deliver an above-average value for their price
Market Size & Growth
Global Private Label Market
The global private label market size is expected to be around USD 915.1 billion in 2024 and is projected to reach USD 1623.4 billion by 2034, growing at a Compound Annual Growth Rate (CAGR) of 5.9% during the forecast period from 2025 to 2034. This long-term projection highlights the sustained growth trajectory anticipated for the private label sector.
The global private-label packaged food market was $415.53 billion in 2024. This shows packaged food private label is a large and fast-growing subsegment of overall private label.
On the other hand, the Global private-label cosmetics market was $10.64 billion in 2024. Beauty private labels are meaningful but far smaller than food; they’re a target for premium private-label strategies.
Private label beauty product sales reached $3.8 billion in 2024 across all outlets, up 4% year-over-year, with standout category growth including women’s fragrances (+53% to $161.8 million), hair conditioner (+81% to $44.3 million), and bath fragrances/bubble bath (+21% to $33.7 million).
US Private Label Market
US private label industry sales grew 3.9% in 2024 from $9 billion in 2023 to a record $271 billion in 2024. This robust growth shows private labels are capturing more shopper spending.
In the first half of 2024, store brands in the U.S. captured approximately 23% of unit market share and 20% of dollar share. This indicates a strong presence in terms of both volume and value within the U.S. retail landscape.
U.S. store-brand products made up about 22% of CPG dollar sales in 2024. This is lower than Europe, but it is the fastest-growing private label market in dollar terms.
European Private Label Market
Europe continues to be a stronghold for private labels, demonstrating a mature and highly penetrated market. As of July 2024, the 52-week sales of private label products across Europe reached an all-time record of ~$412(€354.5) billion. This figure represents a 6% increase, or 20 billion €, in private label turnover.
In comparison, sales for manufacturers’ brands in the same period grew by 4%. Private label products now command a significant 39% of the total grocery market value.
Furthermore, private labels played a crucial role in driving volume growth, experiencing a 3% increase in units, while manufacturers’ brands saw a 1% decrease in volume.
This indicates that private labels are not only capturing a larger share of consumer spending but are also driving overall market volume. The strength of the European market is evident in its widespread adoption.
11 European markets boast a private label share exceeding 30%, with 6 markets even surpassing 40%. Notably, the collective private label share in Europe’s three largest markets—Germany, the United Kingdom, and France—stands at 40%.
Sources: Market Us, PLMA 1, Circana, PLMA 2, Grand View Research 1, Grand View Research 2, Retail Detail, PLMA 3, PLMA International
Increase in Private Label Adoption over time
Private label adoption has significantly increased in recent years, driven by factors like inflation, the search for value, and retailers’ strategic investments. This growth is evident in both sales figures and market share, with private label sales outpacing national brands in some cases.
99.9% of U.S. households purchased at least one private-label grocery item in 2024. Private labels are now essentially universal in U.S. grocery shopping — penetration is highest in core CPG categories, demonstrating broad, routine use rather than niche trial.
Nearly 3 in 5 consumers buy more private-label products than a year ago. Over half of shoppers worldwide are increasing their store-brand purchases, a sign of broad adoption.This global shift reflects both inflation-driven substitution and retailer investments (premium tiers, innovation) that are making private labels attractive across markets.
Sources: eMarketer, Numerator, Retail Dive
Marketplace Platforms & Sellers
On Amazon, 54% of sellers use a private-label model (creating and selling their own branded products). Private label is now the most common approach among Amazon sellers.
Over 60% of Amazon’s sales come from third-party (3P) sellers, the majority of whom are small/mid-sized businesses. This shows private-label products dominating Amazon’s marketplace.
Amazon hosts a huge seller base: about 9.7 million seller accounts overall, with 2 million actively selling. A majority of active sellers are independent brands, many following private-label strategies.
33% of Walmart shoppers buy its private labels very often, compared to 20% for Target and 14% for Amazon, highlighting retailer-specific loyalty to owned brands.
Sources: Jungle Scout, Amz Scout, eMarketer
Consumer Perception of Private Label Value and Quality
The waning stigma around private labels is evident in global consumer sentiment. A significant 23% of US consumers now view private labels as good alternatives to name brands.
40% of US consumers buy private label products to save money. 53% of grocery shoppers say a store’s private label brand quality influences where they shop, ranking it above brand selection or loyalty programs. These figures underline why retailers keep investing in private-label assortments and rapid rollouts.
In the U.S., a 2025 Numerator survey found that 60% of consumers believe private labels deliver an above-average value for their price, indicating a growing appreciation for quality that extends beyond mere affordability.
Price and value are consistently cited as the top reasons consumers choose private label products, with studies indicating that around 71% to 72% of shoppers make their purchases based on these factors.
Trust scores are highest for private label in CPG categories (health & beauty 68%, grocery 67%, household 66%).
Further reinforcing this, a November 2024 McKinsey & Company report revealed that over 80% of U.S. consumers rate the quality of private-brand food products as the same or better than national brands, and nearly 90% believe private brands offer similar or better value.
High-Income Consumers: Growing Prioritization of Private Labels
The appeal of private labels is extending beyond budget-conscious segments to include high-income consumers. Data indicates that high-income shoppers are increasingly prioritizing private labels, with 70% of consumers earning over $100,000 annually selecting their grocery store based on its private label offerings. Furthermore, nearly 40% of both high-income and middle-income shoppers actively purchase private-label items.
Younger Consumers (Gen Z, Millennials): Drivers of Adoption and Preference for Private Brands
Younger generations, particularly Gen Z and Millennials, are proving to be key drivers of private label adoption. In fact, 71% of Gen Z consumers say they sometimes or always buy cheaper versions of name-brand products. These consumers exhibit a notable openness to private labels that align with their personal values, such as health, convenience, sustainability, and a desire for cuisine exploration.
Sources: Talk Business, Ipsos, Reuters, eMarketer, Numerator, McKensey , eMarketer, FMI, Numerator 2
Private Label Growth by Key Department/Category (2024-H1 2025)

Refrigerated private label products saw the most dollar sales growth, followed by beverages. You can find the dollar and unit sales growth breakdown below:
| Department/Category | 2024 Dollar Growth (%) | 2024 Unit Growth (%) | H1 2025 Dollar Growth (%) | H1 2025 Unit Growth (%) |
| Refrigerated | +7.5% | – | +13% | +1.3% |
| General Food | +4.3% | +1.2% (H1 2025) | +2.5% | +1.2% |
| Beverages | +4% | +3.5% | +4.8% | +4.2% |
| Pet Care | +2% (H1 2025) | +3.5% | +2% | +3.3% |
| Home Care | +1.4% (H1 2025) | +3.3% | +1.4% | +3.4% |
| Frozen | +3.8% (H1 2025) | +2.1% (H1 2025) | +3.8% | +2.1% |
| Beauty | +1.1% (H1 2025) | +0.4% (H1 2025) | +1.1% | +0.4% |
| Health | -0.1% (H1 2025) | +0.3% (H1 2025) | -0.10% | +0.3% |
| General Merchandise | -0.4% (H1 2025) | -2.5% (H1 2025) | -0.40% | -2.50% |
Private Label Growth by Key Department/Category (2024-H1 2025)The strong growth observed in categories like Refrigerated goods, Beauty, and the emergence of “affordable luxury” in cosmetics indicates that private labels are successfully diversifying beyond traditional dry groceries. This signals a strategic move towards higher-value, more specialized, and even premium segments, challenging the perception of private labels as only “basic” or “budget.”
Sources: PLMA
Retailer Strategies & Growth Drivers
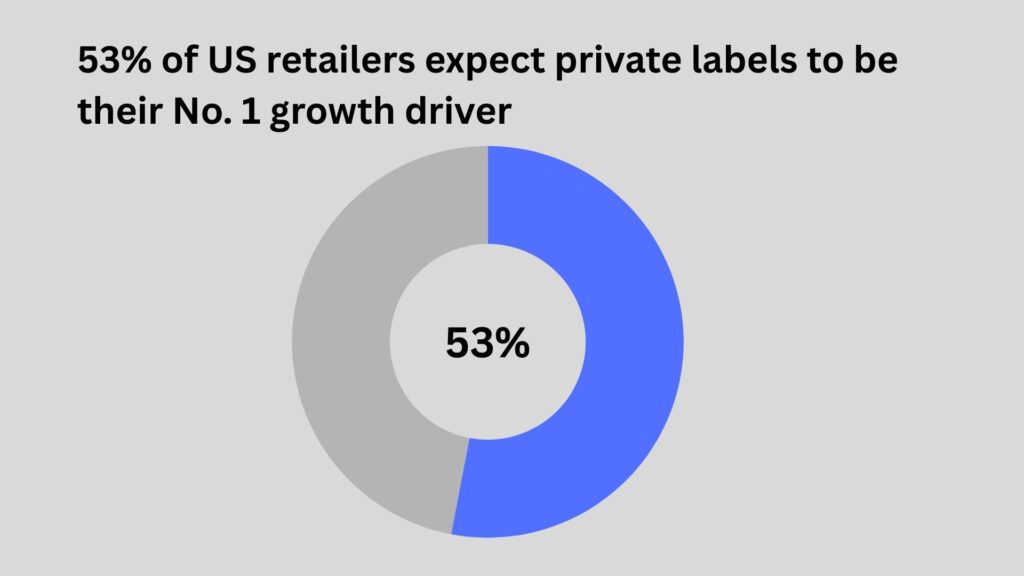
Over half (53%) of US retailers expect private labels to be their No. 1 growth driver in 2024.
Private-label prices rose ~4% while big brands rose ~2% (U.S., 2024–2025 reporting), reflecting retailers passing through some cost but keeping private label relatively cheaper.
Private Label Share of Total Sales by Retailer
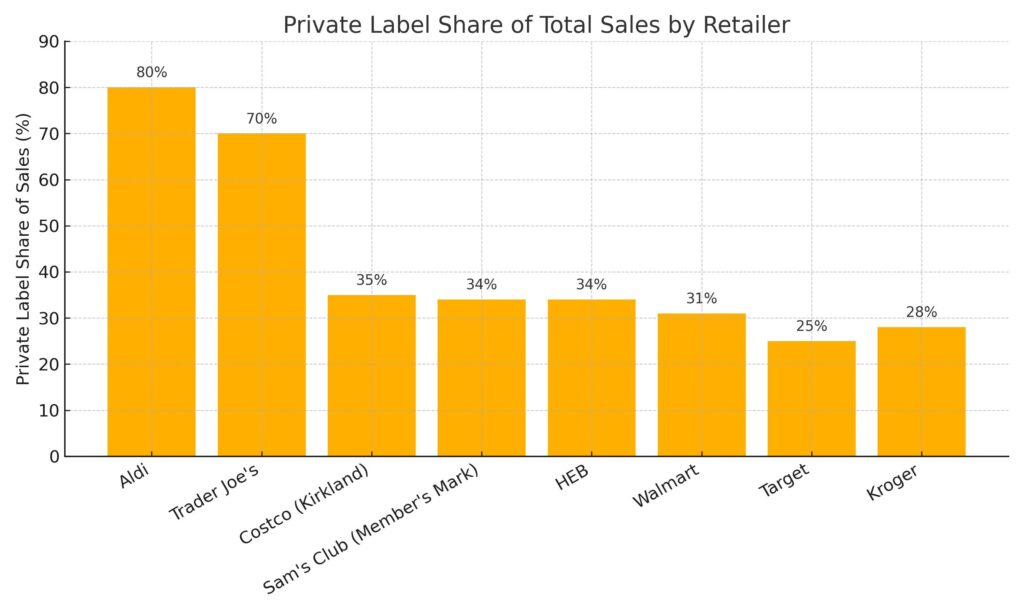
Aldi is dominating private label in terms of total sales, followed by Trader Joe’s. Below is the total sales share of top private label retailers:
- Aldi – 80%
- Trader Joe’s – 70%
- Costco (Kirkland) – 35%
- Sam’s Club (Member’s Mark) – 34% of sales worth $27B
- HEB – 34%
- Walmart – 31%
- Target – 25%
- Kroger – 28%
Sources: Talk Business
Key Takeaways
Private label statistics for 2025 show strong global momentum, with adoption rates climbing across all major retail sectors. From grocery to e-commerce, private labels are reshaping how consumers shop.
Marketplace data highlights their dominance on platforms like Amazon, where more than half of sellers use private-label models and fulfillment services to scale.
Economic trends, shifting brand loyalties, and value-focused shopping behaviors suggest private label growth will continue well beyond 2025.