
We recently analyzed platform data, market research, and real seller benchmarks to answer a simple question:
How much do Instagram Shop sellers actually make in 2026?
Specifically, we broke down:
- Revenue and profit by seller size
- U.S. vs. global earnings
- How much the top 1% sellers make
- What micro-sellers really earn
- And more
Here’s what we discovered.
Table of Contents
- Summary of Our Key Findings:
- The Average Instagram Seller Makes $713 per Month Globally.
- Summary: What Instagram Shop Sellers Make in 2026
- The Average U.S. Based Instagram Seller Makes $2300 per Month.
- U.S. Micro Sellers (1,000 to 10,000 followers) generate between $500 and $3,000 per Month in Revenue
- The U.S. Sellers with 10,000 to 100,000 Followers Generate between $3,000 and $20,000 per Month in Revenue
- Established U.S. Brands with 100K–1M followers generate around $30,000 per Month in Net Profit.
- Top-Tier Brands with 1M+ Followers Generate from $150,000 to $5 million + Per Month in Revenue
- Product tagging adds an average of $851/month for U.S. sellers and $264/month globally
Summary of Our Key Findings:
- The average active Instagram shop seller globally makes $713 per month in revenue.
- The average active U.S. Instagram shop seller makes $2300 per month in revenue — 3.2× higher than the global average.
- U.S. micro-sellers (1K–10K followers) generate between $500–$3,000 per month.
- Small-to-mid U.S. sellers (10K–100K followers) take home approximately $4,289 per month in net profit, equivalent to $51,470 per year.
- Established U.S. brands with 100K–1M followers generate around $30,000 per month in net profit.
- The top 1% of Instagram shop sellers account for an estimated 55–65% of all platform revenue.
- U.S. Instagram commerce totals an estimated $2.3 billion per month, out of a total U.S. social commerce market of $87 billion per year.
- Simply using product tags in posts is correlated with a 37% increase in sales
The Average Instagram Seller Makes $713 per Month Globally.
Active Instagram sellers make an average of $713 per month or 8560 per year.
But averages obscure more than they reveal here.
The reality is that Instagram’s revenue distribution follows the same pattern we see in content, search rankings, and every other platform at scale: a tiny number of accounts capture a wildly disproportionate share of the money.
The top 1% of sellers (large brands, celebrity-founded lines, established DTC companies) likely account for 55–65% of total platform revenue.
That means the median seller — the one right in the middle of the distribution — earns significantly less than $713 per month.
The tiered breakdown below gives a much more honest picture.
Summary: What Instagram Shop Sellers Make in 2026
| Seller Tier | Followers | Monthly Revenue | Monthly Net Profit | Annual Net Profit | Margin |
| Micro (Global) | 1K–10K | $200–$1,500 | ~$264 | ~$3,170 | ~31% |
| Micro (U.S.) | 1K–10K | $500–$3,000 | ~$700 | ~$8,400 | ~40% |
| Small-Mid (U.S.) | 10K–100K | $3,000–$20,000 | ~$4,289 | ~$51,470 | ~37% |
| Established (U.S.) | 100K–1M | $20K–$150K | ~$30,005 | ~$360,060 | ~35% |
| Top Brand (U.S.) | 1M+ | $150K–$5M+ | $135K–$1M+ | $360K–$12M+ | ~18–22% |
| Avg. active seller (Global) | — | ~$713 | ~$214 | ~$2,570 | ~30% |
| Avg. active seller (U.S.) | — | ~$2,300 | ~$920 | ~$11,040 | ~40% |
Read More: How Much Money Do Ecommerce Sellers Make in 2026?
The Average U.S. Based Instagram Seller Makes $2300 per Month.
USA-based Instagram sellers earn significantly more, averaging $2,300 per month in revenue That is 3.2× higher than the global average.
Why is the U.S. average so much higher than the global number?
Three reasons:
American buyers spend more.
The average U.S. Instagram buyer spends roughly $590 per year on the platform, or about $49 per month. When you factor in only monthly-active buyers, that number jumps to $82/month.
U.S. sellers operate in high-margin categories.
Fashion, beauty, wellness, and home goods dominate Instagram commerce in the U.S. — all categories with strong pricing power and healthy margins.
The U.S. seller base punches above its weight.
U.S. sellers represent about 20% of global Instagram shop sellers but capture roughly 31% of global revenue.
Read More: How Much Do Amazon Sellers Make in 2026?
U.S. Micro Sellers (1,000 to 10,000 followers) generate between $500 and $3,000 per Month in Revenue
This is the tier that most sellers start in — and more people are profitable here than you’d expect.
U.S. micro-sellers with 1,000 to 10,000 followers generate between $500 and $3,000 per month in revenue, with a midpoint around $1,750 per month.
What makes this tier interesting is the margin profile.
Because micro-sellers spend little to nothing on paid ads, rely on organic reach, and typically fulfill orders themselves, their net profit margins average around 40%. That works out to roughly $700 per month in take-home profit(considering midpoint of $1,750 per month), or about $8,400 per year.
That’s not “quit your day job” money. But for a solo seller running a side business with minimal overhead, it’s a real income stream — one that compounds as the account grows.
There are an estimated 700,000 active micro-sellers in the U.S. alone.


The U.S. Sellers with 10,000 to 100,000 Followers Generate between $3,000 and $20,000 per Month in Revenue
This is where Instagram selling starts to look like a real business.
U.S. sellers with 10,000 to 100,000 followers generate between $3,000 and $20,000 per month in revenue, with a midpoint around $11,500 per month.
After cost of goods (38%), Instagram ad spend (8.7%), fulfillment, fees, and overhead, the net profit comes to approximately $4,289 per month, which is $51,470 per year.
There are an estimated 220,000 U.S. sellers in this bracket.
Read More: How Much Do eBay Sellers Make in 2026?
Established U.S. Brands with 100K–1M followers generate around $30,000 per Month in Net Profit.
At this level, Instagram selling is unambiguously a business — usually with a team, a warehouse or 3PL partner, and a real marketing budget.
U.S. sellers in the 100K–1M follower range generate between $20,000 and $150,000 monthly, averaging around $85,000 per month in revenue.
Net profit after all costs — COGS, paid ads, fulfillment, staff, overhead — comes to approximately $30,000 per month, or $360,000 per year, at a ~35% margin.
There are an estimated 70,000 U.S. sellers at this tier.
These are brands you’ve likely purchased from, even if you don’t know their names. Many are direct-to-consumer brands recognizable for consistent visual identity, structured product release cadences, and high community engagement rates.
Read More: How Much Money Do Etsy Sellers Make in 2026?
Top-Tier Brands with 1M+ Followers Generate from $150,000 to $5 million+ Per Month in Revenue
The top 1% is a category unto itself.
U.S. sellers with over 1 million followers generate anywhere from $150,000 to $5 million per month in revenue, with net margins in the 18–22% range (lower than smaller sellers, due to team size, ad spend, and infrastructure).
For a brand doing $750,000 per month in revenue, that works out to roughly $150,000 per month in net profit, or $1.8 million per year.
Some of the most recognizable Instagram-native brands in this tier:
- Fashion Nova built a reported over $1000 million annual business almost entirely through Instagram, using influencer drops and shoppable posts as its primary sales channel.
- Kylie Cosmetics scaled to over $351 million in annual revenue with Instagram as its core commerce and marketing platform.
- Gymshark scaled to over $750 million in annual revenue as an Instagram-first athletic wear brand.
There are an estimated 10,000 U.S. sellers in this tier.
Read More: How Much Do TikTok Shop Sellers Make in 2026
Product tagging adds an average of $851/month for U.S. sellers and $264/month globally
Here’s one of the most actionable findings we came across.
Businesses that use product tagging in their Instagram posts see an average sales increase of 37% compared to those that don’t — and when you apply that lift to real seller revenue figures, the dollar impact is hard to ignore.
For the average active seller globally earning $713/month, product tagging translates to an additional $264/month in revenue — from a free feature that takes seconds to set up.
For the average active U.S.-based seller (earning $2,300/month), that same tagging habit generates an extra $851/month — or more than $10,200/year — without touching the ad budget.
Scale that across seller tiers, and the numbers grow fast:
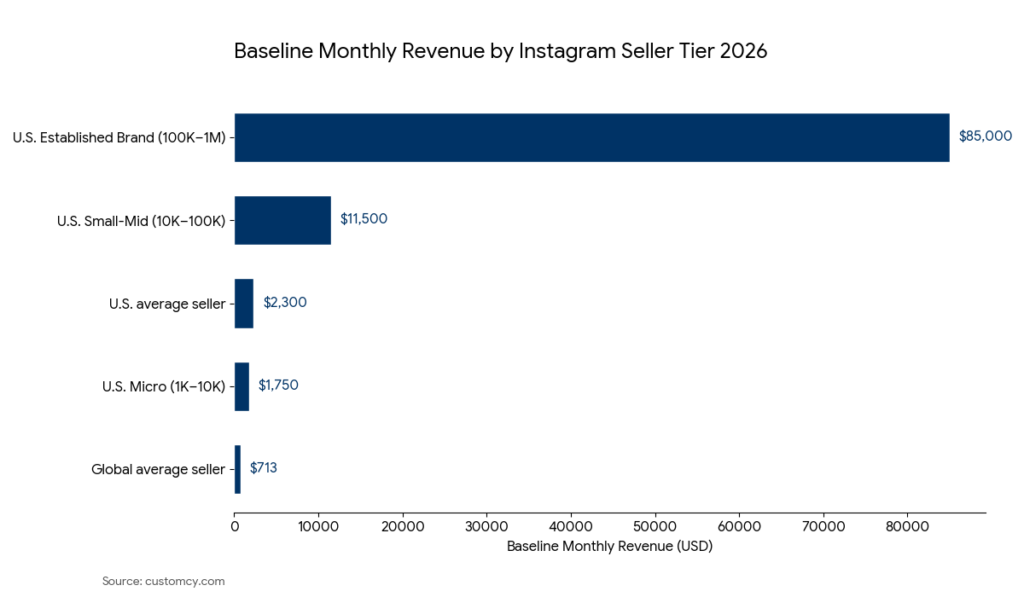
| Seller Tier | Baseline Monthly Revenue | Revenue Added by Product Tagging (+37%) |
| Global average seller | $713/mo | +$264/mo |
| U.S. average seller | $2,300/mo | +$851/mo |
| U.S. Micro (1K–10K followers) | $1,750/mo | +$648/mo |
| U.S. Small-Mid (10K–100K followers) | $11,500/mo | +$4,255/mo |
| U.S. Established Brand (100K–1M followers) | $85,000/mo | +$31,450/mo |
The pattern is the same at every level: product tagging is the highest-leverage zero-cost move available to Instagram sellers.
Read More: How Much Do Top Marketplace Sellers Make in 2026?
What This Means for You
The data tells a clear story — but it’s not the story most people expect.
Instagram’s revenue distribution is not random. Earnings at every tier correlate closely with follower count, category selection, commerce feature adoption, and paid amplification strategy.
It’s a tiered marketplace where your earnings are closely correlated with your follower count, your niche, how consistently you use the platform’s commerce features, and whether you’re willing to invest in paid amplification as you scale.
The micro-seller tier is genuinely accessible — and more profitable (by margin) than any other tier. The small-to-mid tier is where Instagram becomes a real business. And the top tier is dominated by brands that treated Instagram as their primary channel from day one.
The biggest opportunity most sellers are leaving on the table? Product tagging. A 37% revenue lift from a free, two-second action is one of the highest-leverage, zero-cost optimizations available to Instagram sellers.
Methodology
Methodology note: All figures in this article are derived from verified third-party market research, platform-level data, and buyer behavior studies. Full calculation methodology — including data sources, market sizing assumptions, seller count estimates, and margin benchmarks — is available in the Methodology PDF →.
Data sources include Emarketer (December 2025), Capital One Shopping (March 2026), ResearchAndMarkets / SellersCommerce (May 2025), Custom Market Insights (March 2026), Grand View Research (2025), and Meta platform disclosures.