
Looking for the latest new product development statistics for 2026? You’re in the right place. This page provides the most up-to-date information.
Let’s get right into the stats!
Table of contents
- Top New Product Development Statistics (Editor’s Picks)
- Why Most New Products Fail (and What Winners Do Differently)
- Global NPD Spending and Activity
- How Much Revenue Do Successful New Product Launches Generate?
- NPD by Country (Europe focus)
- What Makes Consumers Buy New Products?
- AI and the Future of NPD
- Digital Twins & New Product Development
Top New Product Development Statistics (Editor’s Picks)
- Roughly 30,000 new products launch every year, and 95% of them fail.
- Only 1 in 3 new FMCG (fast-moving consumer goods) launches reached 1% of households across five major European markets in 2025.
- Global R&D spending hit $2.87 trillion in 2024 — nearly triple what it was in 2000.
- Best-performing companies pull 64.2% of their sales from products launched in just the past five years.
- Just 30% of new product development projects go on to become commercial successes.
- Circana’s top-performing 2025 launches brought in a combined $6.2 billion in first-year sales.
- 66% of Spain’s new product launches reached 1% of households — the best hit-rate of any country NielsenIQ tracked.
- One French energy drink launch, Red Bull’s Summer Edition, won back 83% of everyone who tried it.
- PwC projects that 45% of global economic gains through 2030 will come from AI-powered product improvements.












Why Most New Products Fail (and What Winners Do Differently)
How many new products launch each year — and how many survive?
Roughly 30,000 new products launch every year, and Harvard Business School’s Clayton Christensen found that about 95% of them fail.
Even major companies aren’t immune. Google Glass, for example, drew millions in investment before fading out almost as fast as it launched.
Other research puts survival rates in a similar range:
- Only 40% of products businesses launch actually stay on the market (UserGuiding)
- Roughly 1 in 5 products fail to meet customer needs, per the teams that built them (Productside).
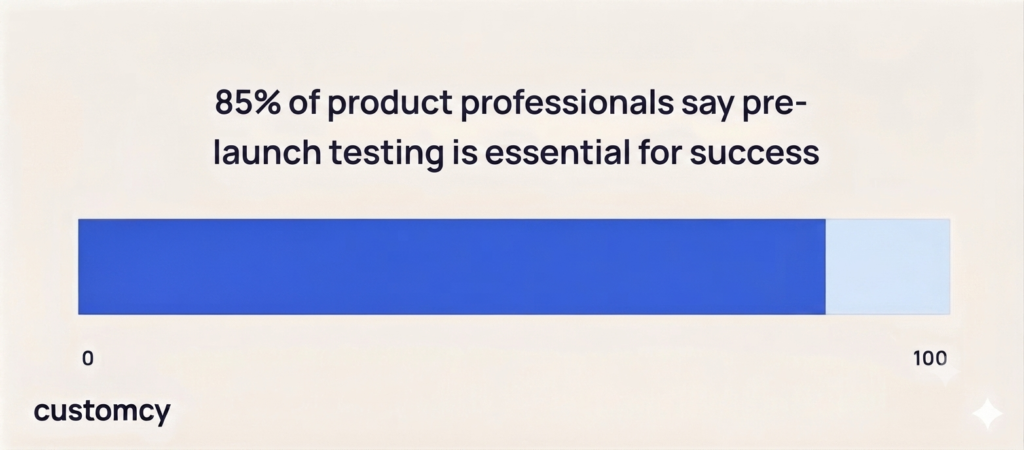
- 85% of product professionals say pre-launch testing is important to success (SurveyMonkey).
How often do new products fail?
NielsenIQ’s research shows the market is unforgiving for products that miss the mark.
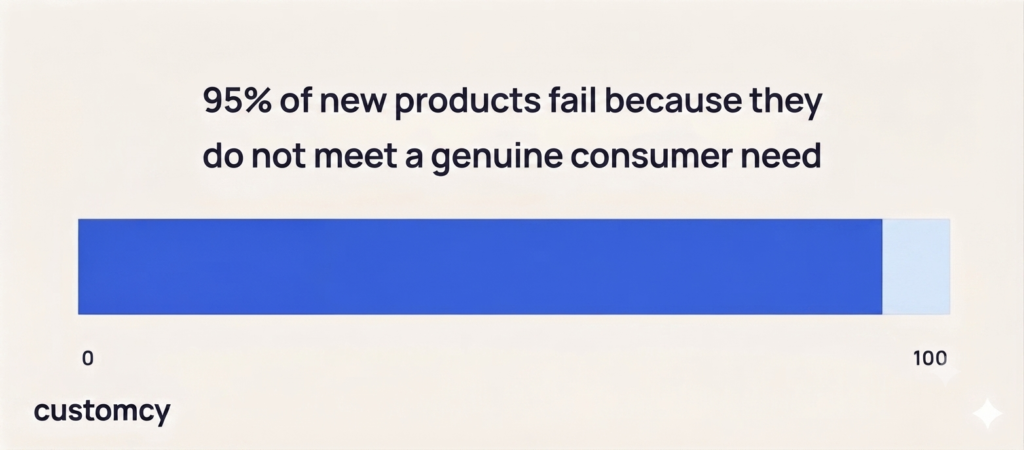
95% of new products fail because they do not meet a genuine consumer need.
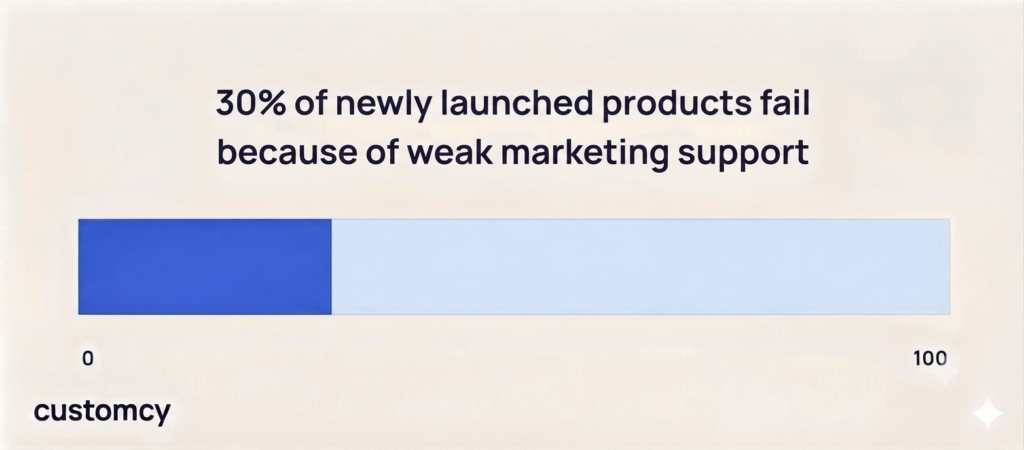
30% fail due to weak marketing support behind the launch.
25% of new launches actually shrink their parent brand’s overall portfolio
What’s the average new-product success rate?
The 2021 PDMA Global Best Practices Survey studied 651 companies across 37 countries to find out.
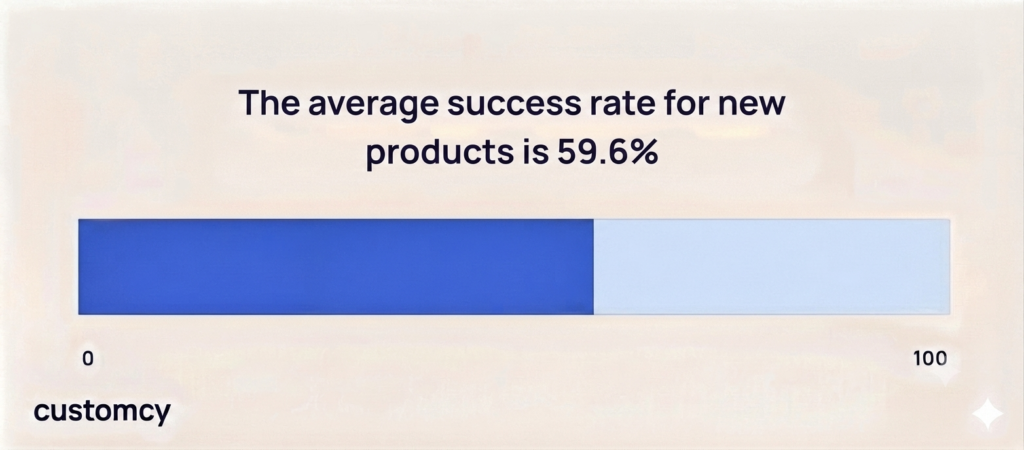
- The average success rate for new products is 59.6%.
- 55.6% of new products met their profitability targets.
- On average, new products generated 45.2% of company sales over a five-year period.
- On average, new products accounted for 44.0% of the company’s profits over a five-year period.
Best performers vs. everyone else
PDMA split companies into “Best” performers and the “Rest.” Only 32.3% of companies made the Best category.
| Metric | “Best” Performers | “Rest” of Companies |
| 5-year new product success rate | 75.3% | 51.4% |
| Share of sales from products <5 yrs old | 64.2% | 35.5% |
| Share of profits from new products | 64.8% | 33.3% |
| New products meeting profitability targets | 73.4% | 46.5% |
| Revenue invested in radical innovation | 26.3% | 14.1% |
| Share of NPD profit from radical innovation | 30.4% | 19.1% |
| Share of NPD profit from incremental innovation | 35.0% | 51.6% |
Best performers invest more heavily, and more radically, than everyone else.
Does radical innovation pay off?
- 51.4% of companies with 21%–50% radical-innovation projects made the Best category
- Companies with zero radical-innovation projects had only a 15.9% chance of reaching Best status
Does company mindset matter?
PDMA compared “Prospector” companies, which are proactive innovators, with “Reactor” companies, which mostly respond to competitors. The results showed a clear difference: 48.0% of Prospectors were best performers, compared with just 11.5% of Reactors. Prospectors also had a higher 5-year success rate of 64.4%, versus 45.4% for Reactors.
Process discipline plays a role, but it isn’t the deciding factor on its own.
- 40.0% of Best performers used a formal, cross-functional Stage-Gate process, vs. 35.2% of others
- 21.9% of Best performers used Agile iterative development, vs. 12.8% of others
- Only 6.0% of Best performers had no standard development process, vs. 13.3% of others
Why do startups fail?
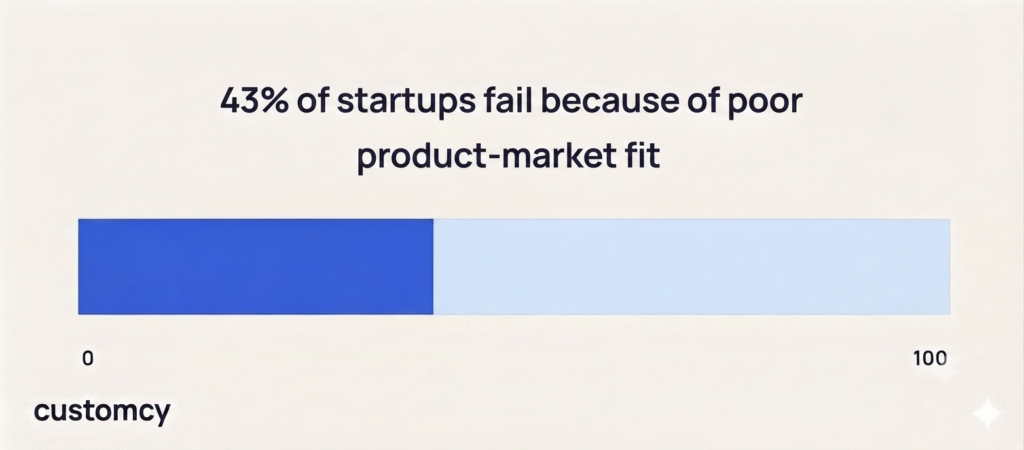
CB Insights found 43% of startups fail because of poor product-market fit.
Other main reasons for startup failure are as follows:
| Reason Cited for Startup Failure | Share of Failures |
| Poor product-market fit | 43% |
| Wrong market timing or macro conditions | 29% |
| Ineffective strategic pivots | 6% |
| Technical or clinical issues | 3% |
Poor product-market fit alone causes more startup failures than the next three reasons combined.
These failure patterns are exactly why manufacturing partners matter earlier in the process. Customcy works with brands during product development to reduce launch risk — helping validate concepts, manage production, and get new products to market with fewer of the missteps outlined above.
Why do product managers spend so little time on strategy?
A Productside survey found most product managers are stuck in execution mode, not strategy.
Just 28% of product managers reported spending time on strategizing. The other 72% focused on day-to-day tactics and execution.
Where does product strategy actually come from?
ProductPlan’s 2023 State of Product Management report found strategy rarely comes from internal market analysis.
- 52% of product managers say strategy is mainly shaped by executives or direct customer feedback
- 35% primarily rely on customer feature requests
- 26% primarily rely on feedback from sales and support teams
- 19% say senior leadership decides priorities instead of the product team
- Only 16% primarily prioritize based on competitor and market analysis
Do roadmaps focus on the right things?
- 54% of roadmaps are built around outputs (the features shipped).
- Only 44% communicate outcomes (the results those features are meant to drive).
- 25.3% of product managers say company strategy isn’t very clear, or isn’t clear at all (Roadmap.com).
- Over 50% of large product teams (50+ people) cite keeping roadmaps and processes consistent as their top growing pain.
Why do NPD investments miss expectations?
Even well-funded NPD projects can underdeliver. ProductPlan asked product leaders directly why their investments fall short of senior management’s expectations.
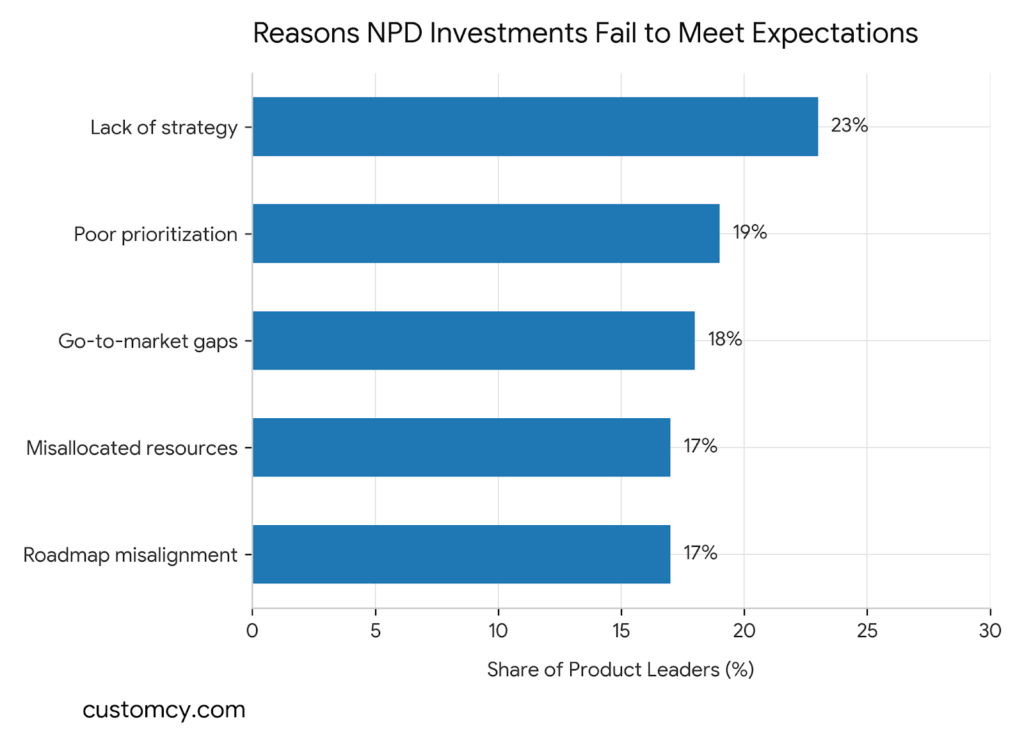
The answers cluster around one theme: strategy problems outweigh execution problems. No single factor dominates, but the top five reasons account for the vast majority of underperformance.
| Reasons NPD Investments Fail to Meet Expectations | Share of Product Leaders |
| Lack of clear company strategy | 23% |
| Poorly prioritized ideas or features | 19% |
| Ineffective go-to-market strategy | 18% |
| Misallocated resources | 17% |
| Underdeveloped roadmap misaligned with strategy | 17% |
These numbers point to one root cause again and again: companies aren’t sure what to build, or why.
Sources: NielsenIQ; MIT, PDMA / Journal of Product Innovation Management; CB Insights; UserGuiding; Productside; SurveyMonkey; ProductPlan; Roadmap.com.
Global NPD Spending and Activity
How much does the world spend on R&D?
Worldwide R&D spending hit $2.87 trillion in 2024, per WIPO’s Global Innovation Index. That’s up nearly 3% from $2.78 trillion in 2023.
Global R&D spending has almost tripled in real terms since 2000, closing in on the $3 trillion mark.
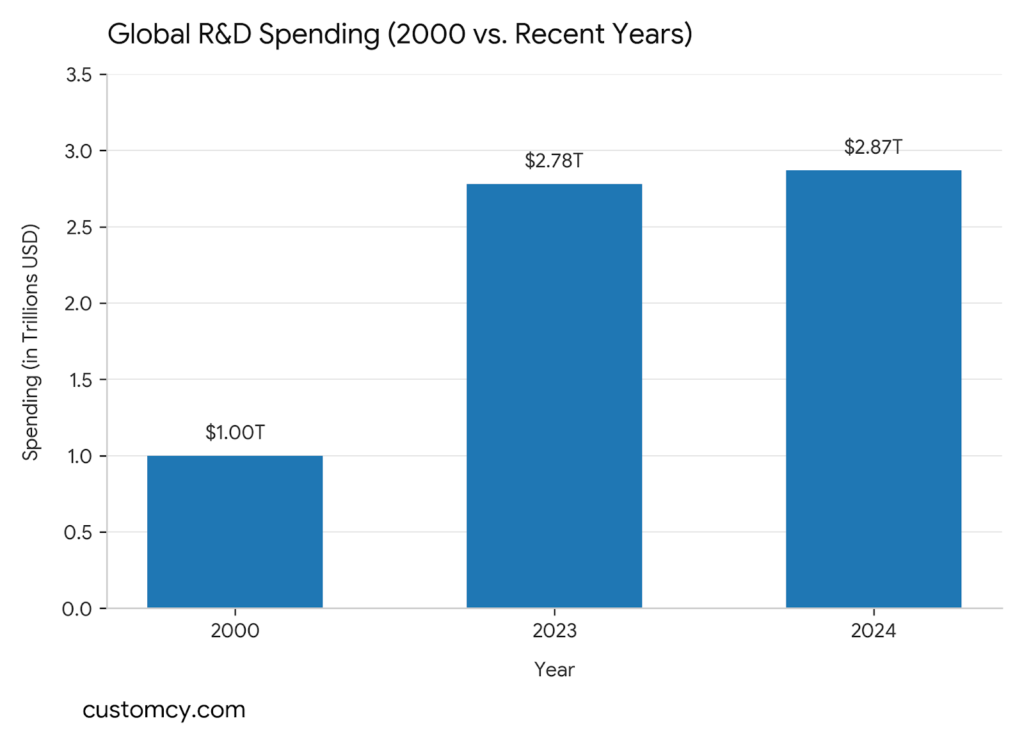
R&D intensity — total spend as a share of world GDP — reached about 2.0% in 2024, up slightly from 1.99% in 2023.
Which countries spend the most on R&D?
China and the United States are neck-and-neck at the top of global R&D spending.
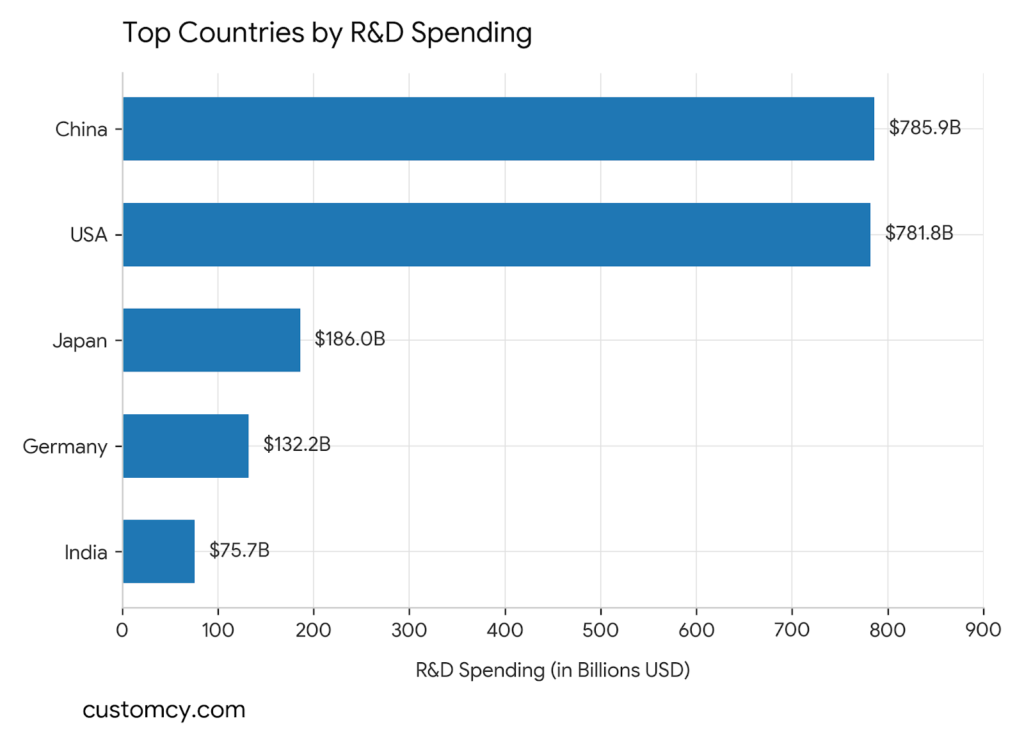
| Country | 2024 R&D Spend |
| China | $785.9 billion |
| United States | $781.8 billion |
| Japan | $186 billion |
| Germany | $132.2 billion |
| India | $75.7 billion |
China overtook the US as the world’s top R&D spender in 2024, though the two totals are close.
Total dollars don’t tell the whole story. Some smaller economies put a much bigger share of their GDP into R&D.
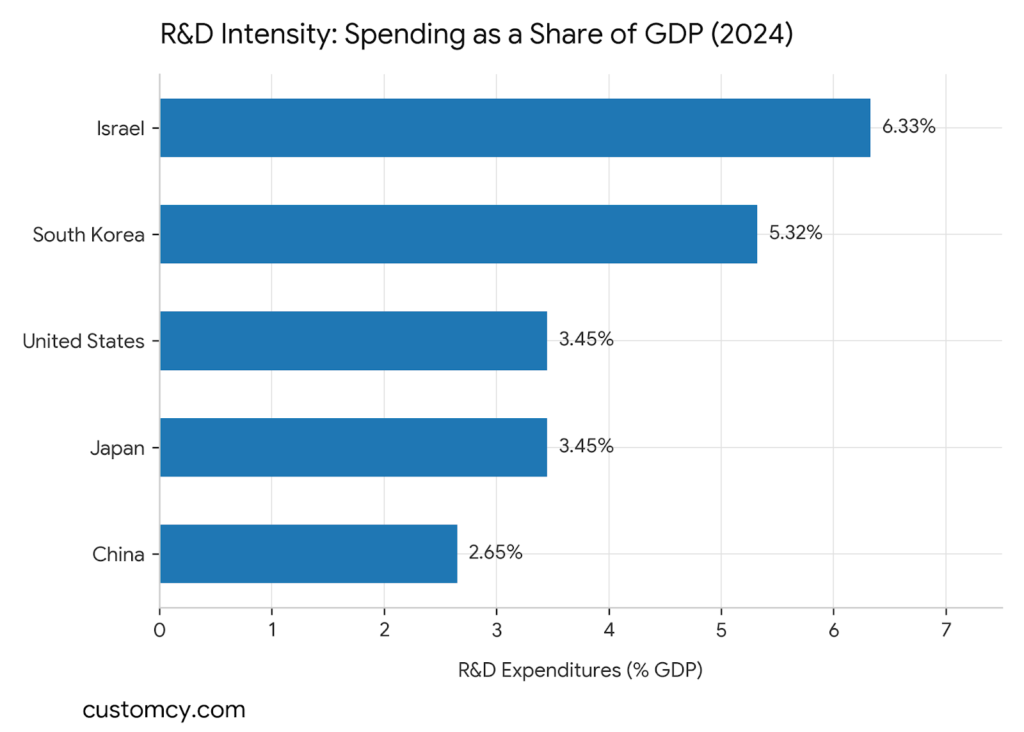
| Country | R&D Spend as Share of GDP (2024) |
| Israel | 6.33% |
| South Korea | 5.32% |
| United States | 3.45% |
| Japan | 3.45% |
| China | 2.65% |
Most countries invest far less. 72% of economies spent under 1% of GDP on R&D in 2024, and 53% spent under 0.5%.
Who funds R&D — governments or businesses?
In most leading R&D economies, private businesses foot the bill, not governments.
| Country | Private-Sector Share of R&D Funding (2024) |
| Israel | 93% |
| Vietnam | 90.5% |
| Ireland | 86.1% |
| South Korea | 79.2% |
| Japan | 79.1% |
| United States | 78.4% |
| China | 77.7% |
R&D spending by industry
R&D investment isn’t spread evenly across industries. Biotech and hardware dominate in different parts of the world.
- US businesses spent $117.1 billion on biotech R&D in 2022 — the highest of any reporting economy
- Biotech made up 17% of all US business R&D that year.
- Chemicals manufacturing put 71% of its R&D budget ($88.6 billion) into biotech.
- Only 1% of US companies used biotech in 2021, vs. 32% of scientific R&D services firms and 20% of pharma manufacturers
- The information and communication industries accounted for 28% of all U.S. business R&D spending in 2021, making them the country’s largest R&D investment sector.
- Pharmaceutical manufacturing represented 16% of total U.S. business R&D spending in 2021, making it the second-largest industry for research investment.
- Computer, electronic, and optical products dominated business R&D in East Asia, accounting for 78% of Taiwan’s and 49% of South Korea’s total business R&D spending in 2021.
What does it cost to bring a new drug to market?
Deloitte found the average cost of taking a new drug from discovery to launch rose to $2.671 billion in 2025, up from $2.229 billion in 2024.
Sources: WIPO; NSF/NCSES; Deloitte
How Much Revenue Do Successful New Product Launches Generate?
Circana’s 2025 New Product Pacesetters report, which tracks the strongest-performing consumer product launches in the U.S., found that the year’s top launches generated $6.2 billion in combined first-year sales.
The median first-year sales for a Pacesetter launch reached $19 million, showing that successful new products can quickly become meaningful revenue contributors for brands.
Successful launches also played a major role in category growth:
- Circana’s top-performing new products contributed 21% of total store sales growth in their measured categories.
- Winning launches often created incremental growth rather than simply replacing existing products.
Best-Performing Companies Generate More Revenue From New Products
New product success is not only about individual launches. Companies that consistently innovate generate a larger share of their revenue from recently introduced products.
According to the PDMA Global Best Practices Survey, companies classified as top innovation performers generated:
- 64.2% of sales from products launched within the previous five years
- 64.8% of profits from new products
By comparison, average companies generated only:
- 35.5% of sales from products less than five years old
- 33.3% of profits from new products
This shows that innovation leaders do not just launch more products — they build systems that turn new products into major revenue streams.
Successful product launches don’t begin on launch day—they start with a well-developed prototype and reliable manufacturing partner. Customcy works with startups, ecommerce brands, and established companies to develop custom products in wood, leather, marble, ceramics, metal, and other materials, supporting both prototype development and commercial production.
Sources: Circana, PDMA / Journal of Product Innovation Management
NPD by Country (Europe focus)
NielsenIQ tracked new brand and sub-brand launches across five European countries throughout 2025.
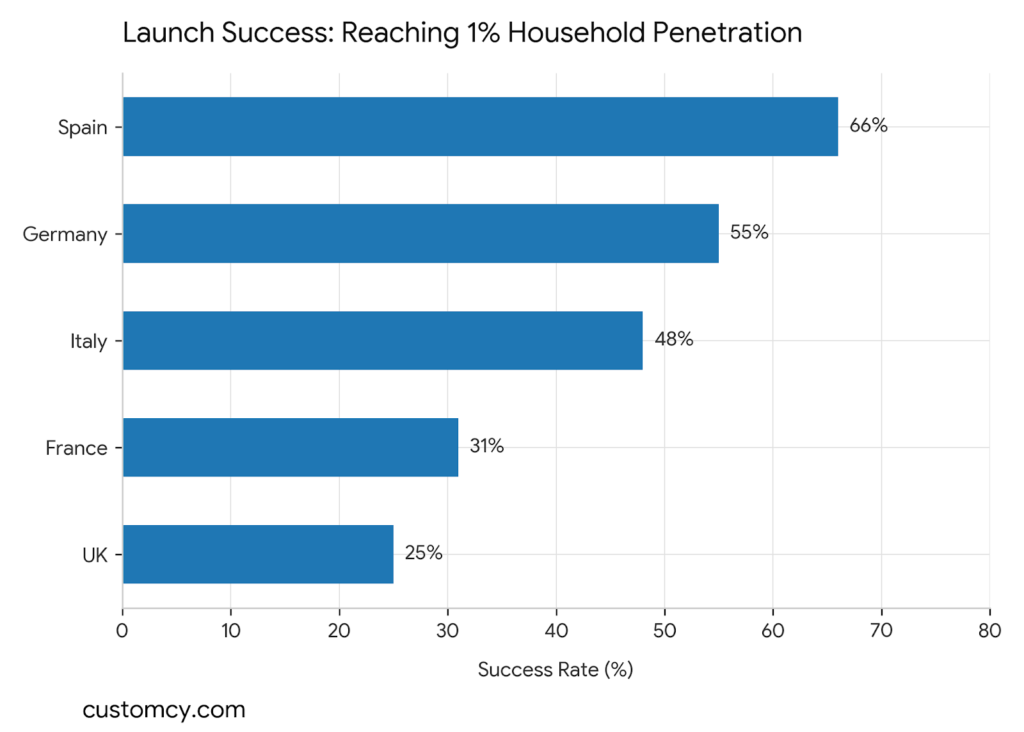
It measured two things: household penetration (the share of households that try a product) and repeat rate (the share of triers who buy again).
| Country | New Launches (2025) | % Branded | % Reaching 1%+ Penetration | Avg. Penetration (36 wks) | Avg. Repeat Rate (36 wks) |
| United Kingdom | 2,053 | 42% | 25% | 0.7% | 27.2% |
| France | 738 | 69% | 31% | 0.8% | 19.3% |
| Germany | 406 | 61% | 55% | 1.2% | 25.6% |
| Italy | 280 | 72% | 48% | 1.0% | 22.8% |
| Spain | 150 | 49% | 66% | 1.4% | 31.2% |
United Kingdom: most launches, lowest hit-rate
- The UK recorded 2,053 new product launches in 2025, nearly three times as many as France.
- Branded products accounted for just 42% of new launches in the UK, the lowest share among the five countries studied.
- Only 25% of new product launches in the UK reached more than 1% household penetration, indicating relatively low commercial success.
- Private-label products represented 58% of all new product launches in the UK, the highest share among the five countries analyzed.
One trend stood out: UK households using GLP-1 weight-loss drugs bought branded products 61% of the time, versus 42% for shoppers overall.
France: High Branded Share, but Weak Repeat Purchases
- France recorded 738 new product launches in 2025, with branded products accounting for 69% of all launches.
- About 31% of new launches reached more than 1% household penetration.
- France had the lowest 36-week repeat purchase rate among the five markets at just 19.3%, suggesting many new products struggled to retain buyers.
- Perishable Food was the strongest-performing category, with 37% of launches surpassing the 1% household penetration threshold.
Germany: Europe’s Strongest Market Penetration
- Germany introduced 406 new products in 2025, with branded products making up 61% of launches.
- More than half (55%) of new products achieved over 1% household penetration, more than double the UK’s success rate.
- Home Care was Germany’s best-performing category, with 83% of new product launches exceeding the 1% penetration benchmark.
Italy: The Most Brand-Focused Market
- Italy launched 280 new products in 2025, with branded products representing 72% of launches—the highest branded share among the five countries studied.
- Nearly half (48%) of new launches reached more than 1% household penetration.
- Home Care again emerged as the top-performing category, with 61% of launches breaking through the 1% penetration threshold.
Spain: Fewer Launches, Higher Success
- Spain introduced just 150 new products in 2025, the fewest among the five European markets analyzed.
- Despite the lower launch volume, 66% of new products achieved more than 1% household penetration, the highest success rate in Europe.
- Spain also recorded the highest 36-week repeat purchase rate at 31.2%, indicating stronger long-term consumer acceptance than any other market in the study.
- Confectionery and Snacks was the standout category, with 19 of 24 launches surpassing the 1% household penetration benchmark.
Volume and success don’t move together. The UK launched the most products; Spain, with 14x fewer launches, had far better odds of success.
How many European launches actually succeed?
More than 3,500 new brands and sub-brands launched across the UK, Germany, France, Italy, and Spain in 2025.
Only 33% of them reached 1% of households in their own country.
Which categories break through most often?
| Category | New Products (EU5) | % Reaching 1%+ Penetration |
| Total FMCG | 3,627 | 33% |
| Paper Products | 73 | 49% |
| Home Care | 184 | 48% |
| Non-Alcoholic Beverages | 310 | 46% |
| Health & Beauty | 238 | 43% |
| Food – Ambient | 698 | 32% |
| Confectionery & Snacks | 718 | 31% |
| Food – Perishable | 851 | 31% |
| Alcoholic Beverages | 82 | 28% |
| Food – Frozen | 397 | 23% |
| Pet Food | 74 | 19% |
Healthcare is excluded: only 2 launches were tracked across all five countries — too few to be meaningful.
Do the busiest categories actually win?
Not always. The categories launching the most products aren’t necessarily the ones converting best.
- Confectionery & Snacks and Frozen Food launch new items at almost 2x the rate you’d expect from their category value
- Crowded categories (Food, Confectionery & Snacks) recruit trial fastest, but struggle to bring shoppers back
- Less crowded categories (Paper Products, Pet Food, other Non-Food) recruit slower but retain shoppers better
How rare is winning on both trial and repeat?
Very rare. Only 17% of Branded launches outperformed their category’s median on both trial and repeat at once.
For private label products, that share was even lower — just 14%.
Europe’s top-performing launches
A handful of individual products stood out — some on trial, some on loyalty, a few on both.
| Country | Top Trial Performer | Trial Rate | Repeat Rate |
| UK | Cadbury Dairy Milk Lotus Biscoff | 13.4% | 34.1% |
| Italy | Mulino Bianco Alveari | 8.8% | 32.1% |
| Germany | Rotkäppchen Secconade | 6.1% | 34.3% |
| France | Cif Infinite+ | 6.0% | 34.8% |
| Spain | Fairy Poder 3 en 1 | 5.4% | 22.8% |
| Country | Top Repeat Performer | Repeat Rate | Trial Rate |
| France | Red Bull Summer Edition | 83.0% | 4.3% |
| Spain | Mahou Reserva | 48.7% | 1.5% |
| UK | Pepsi Zero | 48.0% | 7.9% |
| Germany | Hohes C Vitamin Water | 41.1% | 5.9% |
| Italy | Monster Rio Punch | 40.5% | 2.1% |
France’s Red Bull Summer Edition is the standout: it won back 83% of everyone who tried it — the highest repeat rate recorded in any country.
There’s no single formula for success. A launch’s country, category, and positioning all shape whether it becomes one of the rare double-winners.
Source: NielsenIQ
What Makes Consumers Buy New Products?
77% of consumers say convenience influences purchase decisions — shows demand for easier solutions.
Reliability, features, and price are the strongest purchase drivers — explains why many launches succeed or fail.
Nearly half of consumers are willing to spend money to save time — supports efficiency-focused innovation.
72% consider sustainability when shopping online — supports sustainable product design.
Consumers are willing to pay 9.7% more for sustainable products — connects sustainability with commercial opportunity.
Sources: Morgan Stanley, Forrester, Euromonitor, DHL, McKinsey
AI, Digital Twins, and the Future of NPD
PwC estimates 45% of global economic gains through 2030 will come from AI-powered product improvements.
How many companies actually use AI in product development?
- Only 41% of companies use data analytics or AI in product development at all
- Just 5% use it comprehensively
- 28% of organizations report using generative AI specifically in product or service development (McKinsey)
- Large early-adopter firms have cut development times by up to 50% using AI (IEEE)
Digital Champions vs. Digital Novices
PwC splits companies into “Digital Champions” (the most digitally mature) and “Digital Novices” (the least).
| Metric (5-Year Outlook) | Cross-Industry Average | Digital Champions |
| Efficiency gain | 19% | 31% |
| Time-to-market reduction | 17% | 28% |
| Production cost reduction | 13% | 20% |
Digital Novices expect gains of just 6% to 9% across these measures — Champions outperform them 2x to 4x over.
Does spending more money guarantee better results?
No. 61% of Digital Champions hit top-tier performance while spending less than 4% of revenue on R&D, below the 4.5% industry average.
It’s how companies spend, not how much, that separates the winners.
How much revenue comes from new products?
- Only 5% of companies overall earn more than 30% of revenue from products launched in the past 2 years
- 29% of Digital Champions clear that bar, vs. 0% of Digital Novices
- Champions average 22% of revenue from new products (under 2 years old), vs. 8% for Novices.
How much revenue comes from fully digital products?
- 14% of Digital Champions earn 30%+ of revenue from fully digital products or services
- Companies overall average just 8% of revenue from fully digital offerings
Is cybersecurity keeping up with digital product development?
Not really. 71% of companies lack a mature approach to managing cyber risk during product development.
34% have no formal secure development program in place at all.
What’s next: personalization and tool adoption
- Digital Champions expect to grow personalized product share by 26% over 5 years — 13x faster than Novices (2%).
- Co-creation tool use projected to grow from 64% to 76% within 3 years
- Agile development adoption projected to nearly double, from 34% to 60% (already 89% among Champions)
- Fully integrated PLM software used by 29% of companies overall today, 61% of Champions, only 12% of Novices.
Digital Twins & New Product Development
A digital twin is a virtual replica of a product or process, used to test and refine it before anything physical gets built.
McKinsey estimates $30 trillion in corporate revenue over the next 5 years will come from products that haven’t reached market yet.
75% of product development executives say further digitization is now a top priority.
How fast is the digital twin market growing?
The digital twin market is expanding rapidly, growing at an annual rate of approximately 60%. At this pace, the market is projected to reach $73.5 billion by 2027. Adoption is already widespread in advanced industries, with nearly 75% of companies reporting at least medium-complexity digital twin implementations, highlighting the technology’s growing role in product development and industrial innovation.
Digital Twin Impact on Product Development Performance
Companies using digital twins have reduced total product development time by 20% to 50%, helping them bring new products to market much faster.
Some organizations have cut the number of physical prototypes from two or three to just one, reducing both development costs and testing time.
Digital twins have also improved manufacturing quality, with companies reporting 25% fewer quality issues after products enter production.
One company increased sales by 3% to 5% by using digital twins to improve product features and overall quality.
Digital twin-enabled aftermarket services have generated 5% to 10% additional revenue in some product categories by creating new service opportunities.
Implementing digital twins at scale can require significant expertise, with mature deployments needing around 50 specialists on a dedicated digital twin platform team.
Digital tools can accelerate product development, but every product eventually needs to be manufactured. Customcy bridges that gap by helping businesses transform digital designs into physical products through custom manufacturing, prototype refinement, quality control, and scalable production.
Sources: PwC; PwC Germany; McKinsey State of AI; IEEE Xplore; McKinsey Digital Twins; Circana; NielsenIQ
Key Takeaways
New product development is a numbers game with long odds. Fewer than a third of NPD projects become genuine commercial successes worldwide.
Across Europe’s biggest markets, roughly two out of three new launches never reach even 1% of households.
The data also shows what separates winners: heavier investment in radical innovation, disciplined-but-flexible processes, and growing use of AI and digital twins.
Global R&D spending has pushed past $2.87 trillion a year. The companies that come out ahead won’t launch the most products — they’ll figure out fastest which ones deserve to stay.
For brands navigating that process, working with an experienced custom product manufacturer like Customcy can shorten the distance between a good idea and a product that actually survives its first year on shelves.