
The U.S. custom products market is growing with each passing year.
Americans don’t just buy products. They customize them.
From engraved engagement rings to corporate-branded socks, the U.S. has built the world’s deepest custom products market — 30% of global spend from just 4% of the world’s population.
With that in mind, in this report, we’ll cover the U.S. custom products market statistics.
Table of Contents
- USA Custom Products Industry Highlights
- What Is a Custom Product?
- The U.S. Custom Product Market Size
- U.S. Custom Products Market Growth Projections
- The Biggest US Custom Product Categories
- Growth Drivers of U.S. Custom Products Market
- US Custom Products Market Trends
- The Complete Market Size Picture of the U.S. Custom Products Market
- About This Report & Methodology
USA Custom Products Industry Highlights
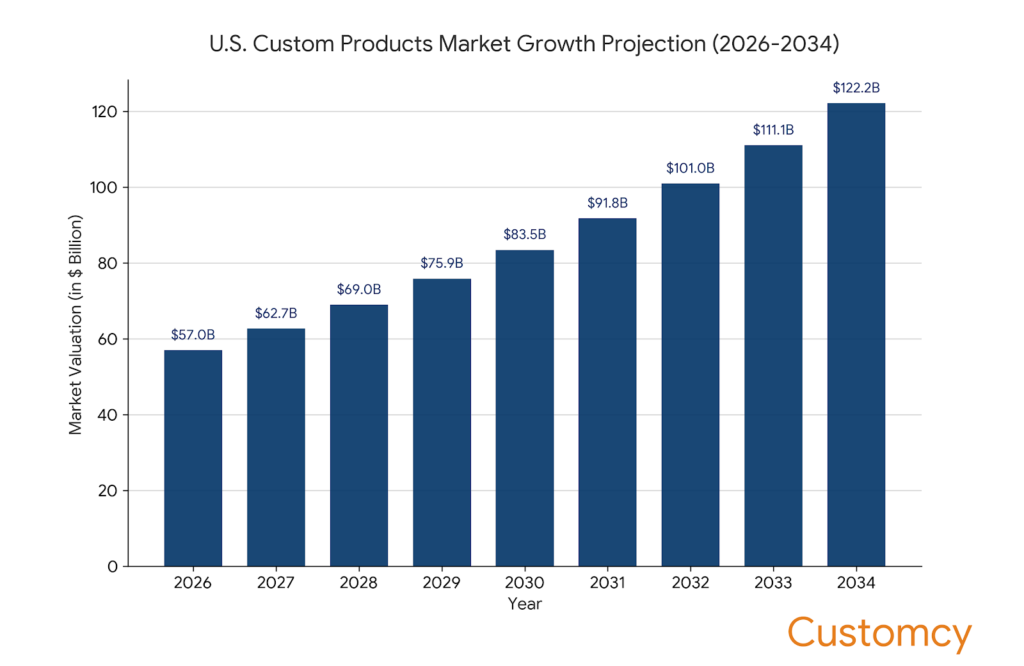
- The U.S. custom products market size is estimated to be $57 billion in 2026.
- The U.S. custom products market is projected to reach $122 billion by 2034, with an approximate 10% CAGR.
- The United States is the world’s largest custom products market, representing 30% of global spend despite being just 4% of the world’s population.
- Custom promotional products is the largest US custom products market category by far, worth $27.8 billion in 2026.
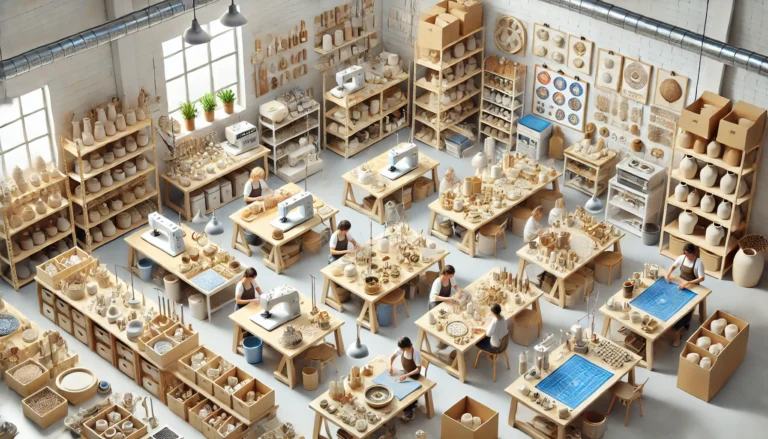
- Custom handmade products are the second largest U.S. consumer category at $5.5 billion in 2026.
- Custom socks are the fastest-growing U.S. category, expanding at a 14.5% annual rate.te.
- The South is the leading US region, accounting for approximately 35% of custom product spending.
What Is a Custom Product?
A custom product is any physical item manufactured or modified to meet a specific person’s or organization’s requirements rather than sold in a standard, ready-made form.
The buyer can be anyone: an individual ordering a monogrammed bracelet, a small business sourcing logo-printed tote bags, or a Fortune 500 company commissioning 10,000 branded water bottles for an annual conference.
The U.S. Custom Product Market Size
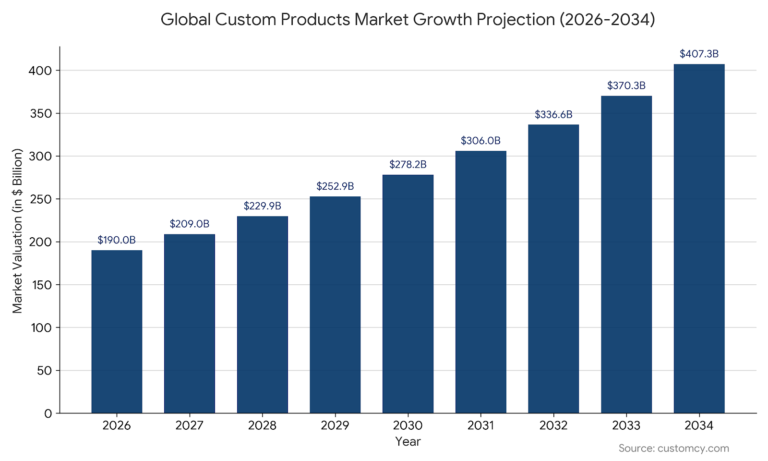
The U.S. custom products market size is estimated to be $57 billion in 2026. The United States is the world’s largest custom products market. It accounts for about 30% of the $190 billion global industry. Yet the U.S. represents only 4% of the world’s population.

That outsized share reflects five uniquely American demand drivers that don’t exist at the same scale anywhere else on earth:
The U.S. promotional products industry is the world’s largest. PPAI primary survey data puts U.S. B2B branded merchandise at $27.1 billion alone — roughly half the entire US custom products market.
The U.S. engagement ring tradition. 88% of American engagement ring buyers prefer custom settings, creating $3.5 billion in the custom jewelry market in the U.S. alone. No other country has this cultural driver at comparable scale.
Pet humanization. Americans spend $152 billion annually on pets — the world’s highest rate. 97% of U.S. pet owners treat pets as family members, driving disproportionate demand for personalized pet products.
These aren’t trends. They’re structural features of American consumer culture that make the US the deepest and most commercially developed custom products market anywhere.
U.S. Custom Products Market Growth Projections
By 2034, the U.S. custom products market is projected to grow to $122 billion at a compound annual growth rate (CAGR) of 10%.
Custom socks is fastest growing custom product category and growing at 14.5% CAGR from 2026 to 2034

| Category | US 2026 | US 2034 | CAGR |
| Custom Socks | $1.4B | $4.0B | 14.5% |
| Custom Dog Bowls | $110M | $300M | 13% |
| Custom Hoodies | $1.4B | $3.7B | 13% |
| Custom Leggings | $1.2B | $3.2B | 13% |
| Custom Phone Cases | $1.3B | $3.3B | 12–15% |
| Custom Puzzles | $300M | $745M | 12% |
| Custom Phone Chargers | $380M | $940M | 12% |
| Custom Hats | $1.5B | $3.2B | 11.5% |
| Custom Mugs | $1.4B | $3.5B | 11.5% |
| Custom T-Shirts | $2.15B | $4.9B | 11% |
Even the slowest-growing U.S. categories beat inflation by a wide margin. Custom stationery — the most mature — still grows at 7% per year.
The Biggest US Custom Product Categories
Here’s a quick look at the top U.S. categories by 2026 market size:
| Category | US 2026 | CAGR | US 2034 |
| Custom Promo Products | $27.8B | 5% | $41B |
| Custom Stationery | $4.4B | 7% | $7.6B |
| Custom Handmade | $5.5B | 10% | $11.8B |
| Custom Pants | $4.5B | 9.5% | $9.4B |
| Custom Jackets | $3.7B | 10% | $8.0B |
| Custom Wall Art | $3.5B | 10% | $7.5B |
| Custom Wood Products | $3.5B | 9% | $7.0B |
| Custom Jewelry | $3.5B | 9% | $7.0B |
| Custom T-Shirts | $2.15B | 11% | $4.9B |
| Custom Tote Bags | $1.4B | 10.5% | $3.1B |
Growth Drivers of U.S. Custom Products Market
AI eliminated the design barrier.
Three years ago, ordering a custom product meant having design skills or paying a graphic designer. That stopped millions of US consumers who wanted custom products but didn’t know what design to use.
Today, AI design tools — Sora, Canva AI, Nano Banana, Midjourney, — generate professional-quality designs from a text description in seconds. A high schooler can now design and order a custom hoodie, phone case, or pendant that looks professionally made.
That barrier is gone permanently. The addressable market just expanded by tens of millions of U.S. consumers who previously self-excluded.
Print-on-demand made US production instant.
US-based POD platforms — Printful, Printify, CustomInk — now cover 200+ product categories. Products are made only after someone orders them. Zero inventory. Zero upfront cost. Zero risk.
Every new product added to POD creates a new custom micro-market. Custom socks, custom dog bowls, and custom puzzles all saw explosive US growth directly after major POD platforms added them to their catalogs.
One in Four Americans Now Customizes Products
About 26% of U.S. consumers customize products. That means more than one in four Americans are actively seeking out customized, made-for-them items — not settling for whatever’s on the shelf.
As AI tools make customization faster, cheaper, and easier to access online, the barrier to “going custom” keeps dropping. What once required a specialty store visit or a big budget now takes a few clicks and a phone photo.
This is why the U.S. custom products market isn’t a niche anymore. With 335 million Americans in the country, a 26% participation rate translates to roughly 87 million active custom product buyers — a consumer base larger than the entire population of Germany.
If you’re looking to reach those buyers, Customcy manufactures custom products across major custom product categories — from branded merchandise to custom leather goods.
The market size numbers throughout this report aren’t growing because of a trend. They’re growing because customization is becoming the default expectation for a quarter of the American buying public — and that share is still expanding.
The creator economy created a distribution revolution.
US-based creators on YouTube, TikTok, and Instagram now sell custom merchandise directly to global audiences with zero inventory or upfront cost. A creator with 500,000 followers drops a custom hoodie design, Printful prints and ships it, and thousands of orders arrive in 48 hours.
This zero-inventory creator merch model has no equivalent from any previous decade of US commerce history. It’s an entirely new demand channel — and it’s growing.
Corporate America is upgrading its merchandise quality.
U.S. businesses are replacing $0.50 pens with $45 premium water bottles. Replacing cheap polyester branded jackets with $150 sustainable custom outerwear. Replacing USB drives with $65 laser-engraved wireless chargers.
Revenue is growing 2–3× faster than unit volume — because the average transaction value is climbing, not just the number of transactions. ESG reporting requirements and corporate sustainability mandates are accelerating this shift in every major U.S. industry.
US Custom Products Market Trends
Custom socks are America’s fastest-growing promo product.
14.5% CAGR makes custom socks the fastest traditional promotional product in this analysis. The U.S. B2B promo channel discovered that branded socks get 4–5× higher response rates than standard giveaways — and simultaneously, photo socks went viral on B2C social media. Both channels accelerating at the same time is extremely rare.
The pet economy is turning animals into brand ambassadors.
Custom dog bowls at 13% CAGR is a small number in absolute terms today — but it’s a massive signal. AI-generated pet portrait ceramics are the #1 emerging POD niche for 2026. When 70%+ of Americans treat pets as family members, every category of custom pet products becomes commercially viable.
The analog renaissance is real in America.
Custom journals ($650M), custom stationery ($4.4B), and custom wood products ($3.5B) all reflect the same U.S. consumer insight: in a world saturated with screens, physical personalized objects carry more emotional weight than ever. Premium custom paper products have gone from practical items to status purchases.
Corporate ESG mandates are creating mandatory custom product demand.
U.S. companies with sustainability reporting obligations are not choosing between standard and custom merchandise — they’re choosing between eco-certified custom options. Premium sustainable branded merchandise is becoming a compliance requirement, not a discretionary spend. This creates a structural demand floor that doesn’t exist in standard merchandise markets.
The Complete Market Size Picture of the U.S. Custom Products Market
Here’s where major U.S. custom products market categories stand — organized by type so the data actually makes sense.
The B2B Engine
This group is the structural foundation of the entire U.S. market.
The U.S. custom promotional products dominate at $27.8 billion in 2026, heading to $41 billion by 2034 at 5% CAGR. US Custom tote bags‘ estimated market size is $1.4 billion and is heading toward $3.1 billion by 2034, with a CAGR 10.5%. California’s plastic bag laws are creating regulatory-driven demand that doesn’t exist everywhere.
The U.S. custom water bottles market is estimated to be $1.0 billion in 2026, projected to reach $2.3 billion at 11% CAGR by 2034, with ESG mandates converting branded bottles from a nice-to-have to a procurement requirement.
| Category | US 2026 | CAGR | US 2034 | Leading Region |
| Custom Promo Products | $27.8B | 5% | $41B | South (~35%) |
| Custom Tote Bags | $1.4B | 10.5% | $3.1B | West (~30%) |
| Custom Water Bottles | $1.0B | 11% | $2.3B | West (~34%) |
| Custom Phone Chargers | $380M | 12% | $940M | West (~38%) |
Custom Apparel
The U.S. custom t-shirts market is leads at $2.15 billion in 2026 and is projected to reach $4.9 billion by 2034 at 11% CAGR.
The US custom hats market is estimated to be $1.5 billion in 2026 and projected to reach $3.2 billion by 2034 at 11.5% CAGR. The U.S. Custom socks mark is the breakout story at $1.4 billion in 2026 and growing at a CAGR 14.5% to reach $4 billion by 2034.
| Category | U.S. 2026 | CAGR | U.S. 2034 | Leading Region |
| Custom T-Shirts | $2.15B | 11% | $4.9B | South (~35%) |
| Custom Hats | $1.5B | 11.5% | $3.2B | South (~36%) |
| Custom Socks | $1.4B | 14.5% | $4.0B | Midwest (~28%) |
| Custom Hoodies | $1.4B | 13% | $3.7B | West (~32%) |
| Custom Pants | $4.5B | 9.5% | $9.4B | West (~30%) |
| Custom Jackets | $3.7B | 10% | $8.0B | Midwest (~28%) |
| Custom Sneakers | $1.0B | 10% | $2.1B | West (~34%) |
| Custom Aprons | $600M | 11% | $1.4B | South (~36%) |
| Custom Skirts | $300M | 11% | $700M | West (~32%) |
Custom Home & Living
The U.S. custom wall art market size is estimated to be $3.5 billion in 2026.
And it’s growing fast — projected to hit $7.5 billion by 2034 at a 10% annual growth rate.
The U.S. custom wood products market size is also estimated at $3.5 billion in 2026, matching wall art dollar for dollar. It’s on track to reach $7.0 billion by 2034 at 9% CAGR.
The U.S. custom curtains market size is estimated at $1.0 billion in 2026, growing to $2.15 billion by 2034 at a 10% CAGR.
| Category | US 2026 | CAGR | US 2034 | Leading Region |
| Custom Wall Art | $3.5B | 10% | $7.5B | West (~30%) |
| Custom Wood Products | $3.5B | 9% | $7.0B | South (~32%) |
| Custom Curtains | $1.0B | 10% | $2.15B | South (~35%) |
| Custom Blankets | $730M | 11% | $1.67B | South (~34%) |
| Custom Cushions | $650M | 11% | $1.5B | South (~34%) |
| Custom Towels | $500M | 9% | $1.0B | South (~36%) |
Custom Stationery, Paper & Handmade
The U.S. custom stationery market size is estimated to be $4.4 billion in 2026. It’s forecast to reach $7.6 billion by 2034 at a 7% CAGR.
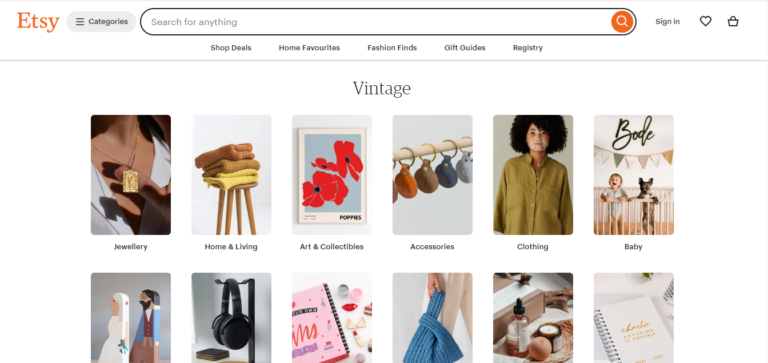
The U.S. custom handmade products market size is estimated at $5.5 billion in ,26 — and it’s one of the biggest numbers in this entire report. The U.S. is the world’s largest buyer market for artisan goods. By 2034, this market is projected to reach $11.8 billion at 10% CAGR.
| Category | US 2026 | CAGR | US 2034 | Leading Region |
| Custom Stationery | $4.4B | 7% | $7.6B | Northeast (~28%) |
| Custom Handmade | $5.5B | 10% | $11.8B | West (~30%) |
| Custom Journals | $650M | 10% | $1.4B | Northeast (~30%) |
| Custom Stickers | $1.6B | 8% | $2.95B | West (~35%) |
Custom Jewelry & Accessories
The U.S. custom jewelry market size is estimated to be $3.5 billion in 2026, projected to double to $7.0 billion by 2034 at 9% CAGR..
The U.S. custom phone cases market size is estimated at $1.3 billion in 2026, on track to reach $3.3 billion by 2034 at a 12–15% CAGR.This is one of the fastest-growing categories in the entire custom products space.
The U.S. custom keychains market size is estimated at $1.4 billion in 2026, growing to $2.8 billion by 2034. What makes this category unique is who’s buying: roughly 70% of demand is B2B. Real estate agents, hotels, and car dealerships are ordering in the thousands — not the dozens.
| Category | US 2026 | CAGR | US 2034 | Leading Region |
| Custom Jewelry | $3.5B | 9% | $7.0B | Northeast (~32%) |
| Custom Phone Cases | $1.3B | 12–15% | $3.3B | West (~32%) |
| Custom Keychains | $1.4B | 7–9% | $2.8B | South (~35%) |
| Custom Pendant | $950M | 10% | $2.0B | Northeast (~32%) |
| Custom Bracelets | $950M | 11% | $2.2B | Northeast (~30%) |
| Custom Earrings | $460M | 11% | $1.05B | West (~30%) |
Custom Gifting & Novelty
The U.S. custom mugs market size is estimated to be $1.4 billion in 2026, projected to reach $3.5 billion by 2034 at an 11.5% CAGR. There are 15 or more gifting occasions every single week of the year — birthdays, anniversaries, holidays, graduations — and a custom mug fits almost all of them.
The U.S. custom toys market size is estimated at $750 million in 2026, growing to $1.7 billion by 2034. Build-A-Bear’s $486.1 million in annual US revenue is proof that the model works at scale. What’s coming next: AI tools are expected to drop the cost of a custom plush toy from $120 down to $45–65, which could unlock a much wider buyer base.
The U.S. custom dog bowls market size is estimated at $110 million in 2026 — small today, but growing at 13% annually toward $300 million by 2034. The bigger story? AI-generated pet portrait products are already being cited as the number one emerging print-on-demand niche for 2026. This category is one to watch.
| Category | US 2026 | CAGR | US 2034 | Leading Region |
| Custom Mugs | $1.4B | 11.5% | $3.5B | South (~34%) |
| Custom Toys | $750M | 11% | $1.7B | South (~34%) |
| Custom Puzzles | $300M | 12% | $745M | Midwest (~30%) |
| Custom Flags | $350M | 9% | $700M | South (~36%) |
| Custom Dog Bowls | $110M | 13% | $300M | South (~36%) |
Whether you’re a brand, a creator, or a business sourcing merchandise, Customcy helps you manufacture custom products at scale — with no minimum orders on 200+ product categories. Start your order →
The Bottom Line
The U.S. custom products market is worth $57 billion in 2026 — the largest national custom products market in the world.
By 2034, the U.S. market will reach $122 billion.
The US has a home-field advantage in almost every category — more institutional buyers, more platform infrastructure, more creator economy distribution, and a deeper consumer culture around personalization than any other market on earth.
That’s the U.S. custom products market. And 2026 is still early innings.
About This Report & Methodology
Every market size figure in this report was produced by Customcy.com using a three-method verification process across all 35 categories.
Here’s exactly how it works.
For every single category, three independent approaches were run and cross-checked against each other:
- A top-down market approach — starting from the total market and working down
- A bottom-up segment build — starting from individual buyers and working up
- A print-on-demand proxy check — using POD data as a real-world anchor
If all three methods pointed to roughly the same number, the estimate was confirmed. If they didn’t, the sources were re-examined until they did.
A minimum of six primary sources were consulted per category, ranked and weighted by a five-tier credibility hierarchy — meaning higher-quality sources carried more weight in the final figure.
The $57 billion aggregate was built bottom-up — by individually sizing each of the 35 categories and adding them up.
This matters because simply summing segment groupings would overstate the total. There is known overlap between the promotional products figure and several individual product categories, and that overlap was deliberately excluded to avoid double-counting.
All figures in this report are in nominal USD, 2026. The CAGRs stated are nominal growth rates. If you’re thinking in real terms, subtract roughly 3–4 percentage points per year from any CAGR shown.
The complete source list, confidence ratings, triangulation examples, and category-level references are all in the companion document:
📄 Research Methodology & Technical Appendix — U.S. Custom Products Market