
This is an updated date list of Customization Statistics for 2025. On this page, you’ll find hand-picked stats about customization.
Let’s get right into the stats!
Customization Statistics (Editor’s Picks)
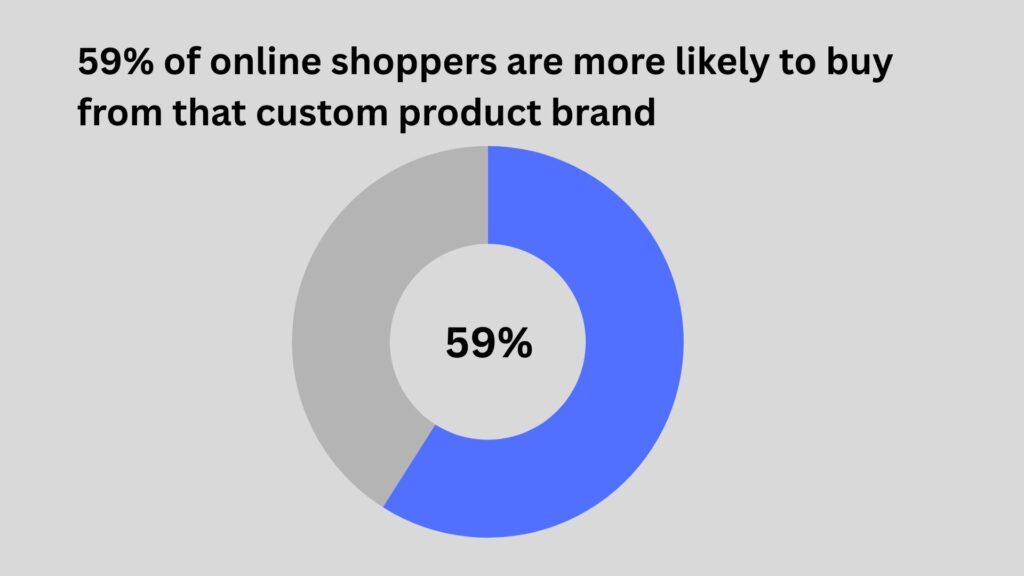
- If product customization is available, 59% of online shoppers say they are more likely to buy from that brand or merchant.
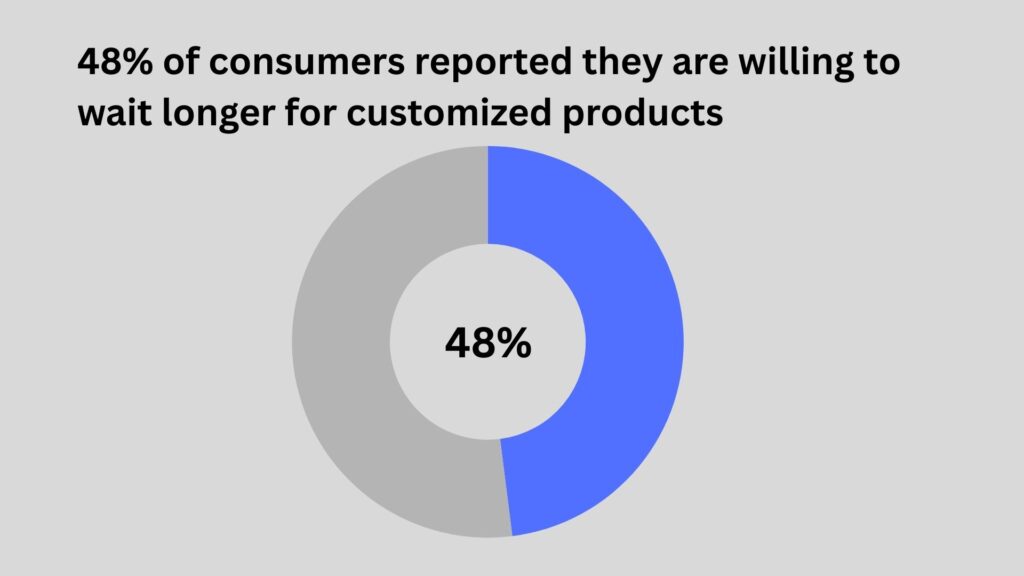
- 48% of consumers reported they are willing to wait longer for customized products.
- Roughly 70% of consumers express a preference for customized products over standard ones.
- One in five consumers said they would pay up to a 20% premium for customized goods or services.
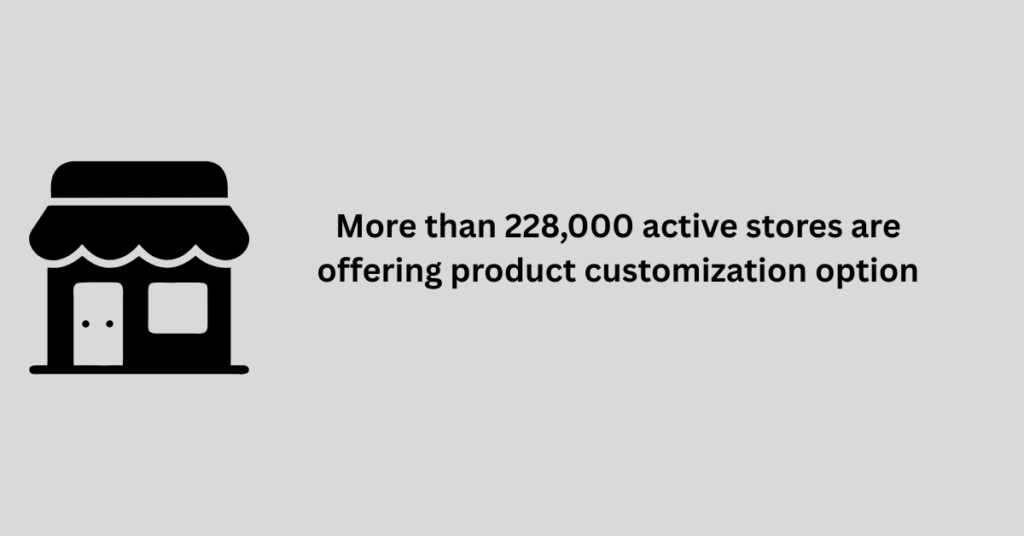
- More than 228,000 active online stores are offering a product customization option.
- Additive manufacturing reduced CO₂e emissions by 24.8% and saved around 50% of material waste
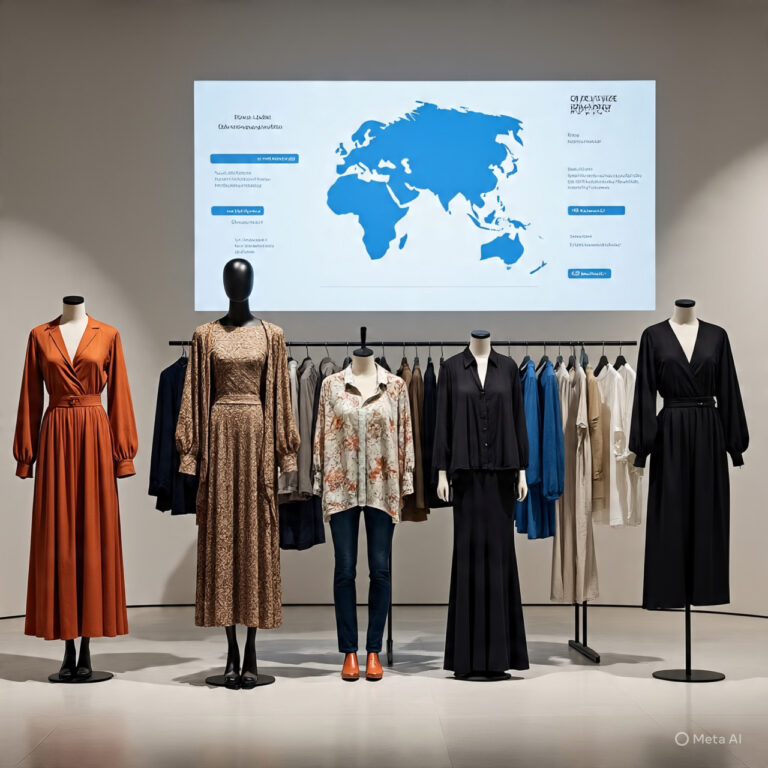
- Apparel is the dominant category for custom goods retailers, with 41.7% of retailers primarily selling clothing.
- Top-selling customized products average 40–50% profit margins.
- YouTube is the top social media platform for custom goods retailers with 125,396 average followers.
- Rich product configurators and advanced visualization tools can increase conversion rates by up to 50%
Market Size & Growth
- The global custom manufacturing market was valued at $939.7 billion in 2024. It is projected to reach $1,356.9 billion by 2031 (≈4.7% CAGR), reflecting huge scale for bespoke industrial production.
- The market for custom-made clothing was $57.55 billion in 2024 (10.9% CAGR to $145.94 by 2033). This rapid growth highlights the rising demand for made-to-order garments.
Global sales of personalized gifts were $29.89 billion in 2024 (projected 6.7% CAGR to $54.15 billion by 2033). This includes engraved, monogrammed, and made-to-order gift items in retail. - The personalized packaging market was about $45.92 billion in 2024 (CAGR ≈5.8%). 5.5% CAGR to $71.10 by 2032).
- The global print-on-demand market was $10.21 billion in 2024, growing at ~26% annually to $102.99 billion by 2034. This includes on-demand printing of apparel, home goods, books, and more via e-commerce platforms.
Sources: Verified Market Research, Customcy, Business Research Insights, Verified Market Research, Business Research Insights 2, Fortune Business Insights, Precedence Research
Consumer Preference
- If product customization is available, 59% of online shoppers say they are more likely to make a purchase from that brand or merchant.
- 48% of consumers reported they are willing to wait longer for customized products.
- Roughly 70% of consumers express a preference for customized products over standard ones.
- One in five consumers said they would pay up to a 20% premium for customized goods or services.
- About 26% of U.S. consumers customize products, indicating more than one in four Americans are actively interested in customization.
- Between 25% and 30% of online shoppers actively seek customization options when browsing products, underscoring consistent baseline demand for tailored experiences.
- For 18% of luxury goods buyers, customization is a decisive factor when making purchase decisions, highlighting its importance in high-end retail.
- Among fashion personalizers, 53% keep up with current fashion trends (versus 30% of other personalizers), indicating apparel-customizers skew more trend-driven.
- About 37% of 18–24-year-old consumers have personalized an item of clothing, showing strong youth adoption of customized apparel.
- Nearly 50% of consumers who personalize products say they would pay more for customization, and among those who’ve customized fashion, 67% report they would pay a premium.
- Customers who designed their own shoes reported a Net Promoter Score (NPS) that was 50% higher compared to standard buyers, indicating stronger satisfaction and brand advocacy.
Platforms, Stores & Scale
- More than 228,000 active online stores are offering product customization option.
- The United States accounts for the majority of top customization stores, with 75.8% of the top 10% of brands offering product customization, mainly selling in the US.
- Around 4.9% of all online stores offer a product customization option.
- Roughly 11.4% of Shopify stores offer product customization.
- Shopify powers roughly 62.8% of stores selling custom products.
- Around 0.6% of Shopify’s offering of custom products use Shopify Plus.
Product catalog sizes
- Average custom goods retailer lists ≈ 44 products. The top 10% of stores offering a product customization option list ≈ 160 products on average (modal = 10 products).
- The top 1% of custom product retailers add around 7 new products/day.
Top Custom Product Categories
- 29% of consumers who customize products do so for apparel and footwear, indicating that fashion is the leading category for customization and a core market for made-to-order offers.
- Apparel is the dominant category for custom goods retailers, with 41.7% of retailers primarily selling clothing. Other popular categories include Home & Garden (~6.9%) and Arts & Entertainment (~5.9%).
- 29% of consumers who personalized products did so for food & beverages, indicating that custom edible products were as popular as fashion for personalization and that customization spans across very different retail categories.
- Technology products rank third for customization at 27%, indicating notable consumer interest in configurable electronics and accessories.
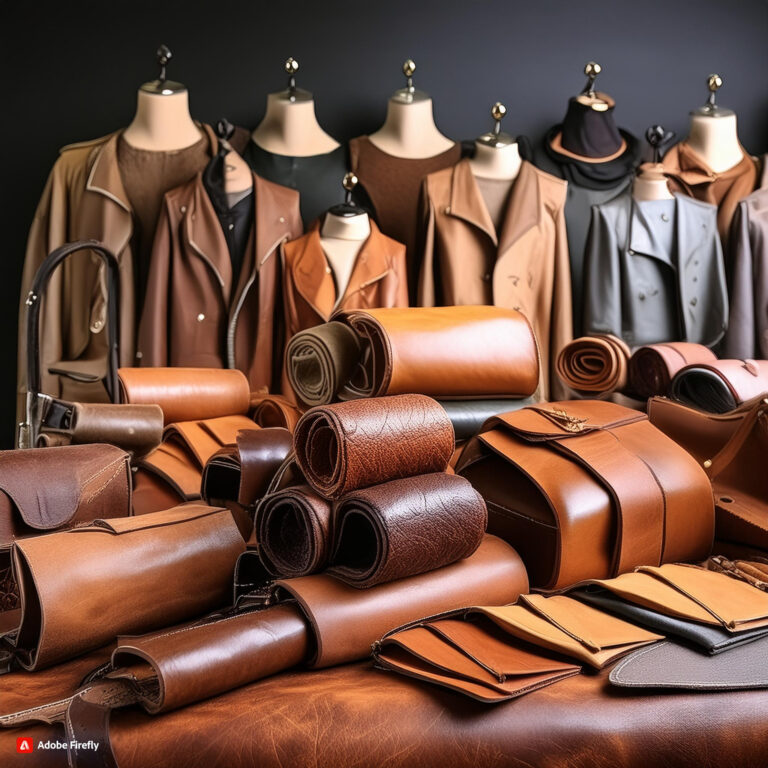
- The category with the most significant percentage of custom-made products sold online in 2023 was furniture (25.15%), followed by the category of bags and baggage.
| Category | Share of Custom-Made Products Sold Online |
| Furniture | 25.15% |
| Luggage and Bags | 24% |
| Home and Garden | 20% |
Sources: Shopify, Forbes, eMarketer, Printify, Statista Gelato, Bain & Company, Statista, Business 2 Community, Do Dropshipping
Performance & longevity
- 24% of businesses offering a product customization option remain active after 3 years.
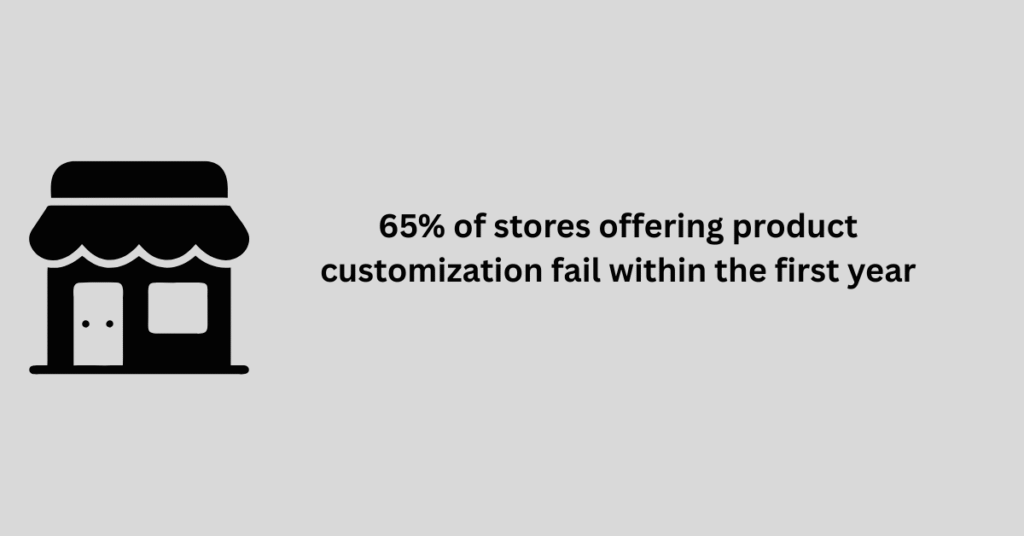
65% of stores offering product customization fail within the first year (high early churn).
- Median monthly visitors for the top 10% of customization stores is 1,978.
- 3.8% of customization stores estimate monthly revenue > $50,000.
Conversion, traffic & interest for Customization Stores
- The estimated average conversion rate for brands offering a product customization option is around 1.7%.
- Google Trends interest in customization (print-on-demand subset) grew ~300% over 5 years (~32% annual).
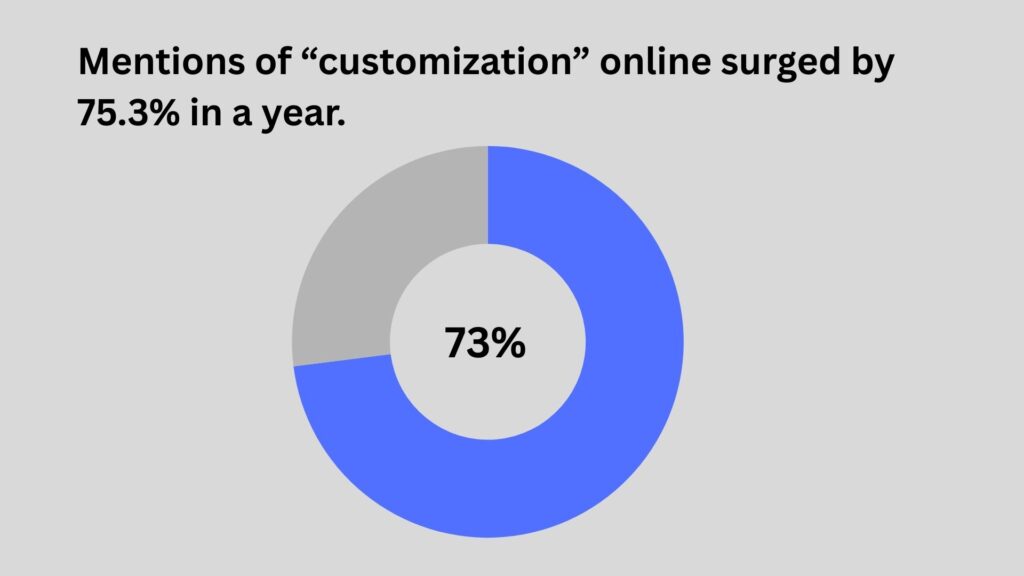
- Mentions of “customization” online surged by 75.3% in a year.
- Global monthly Search volume of “customization” terms is 144.5K. On the other hand, the global monthly search volume of “custom” terms is 476K. Showing strong interest in customization and related terms.
- Mentions of the term “customization” have doubled between 2017 and 2021 in filings from the apparel industry. This term has seen exponential growth over the recent months
Suppliers & marketplace shares
- 67.6% of brands offering a product customization option use a leading customization supplier, Printful, with Printify sharing ~30.4%; AOP+ ~10%; Gelato ~6.7%. ~12% of stores offering custom products use both Printful and Printify. Other dominant b2b players for custom product manufacturing are Customcy and Xometry.
Number of Listings of Top Custom Goods Retailers
- High-volume sellers maintain 500+ listings on average.
- Top sellers publish ≈ 10 new listings per week.
- On average, merchants publish ≈ 67 listings before reaching $1K gross merchandise value.
- ~40% of a store’s listings typically generate the majority of revenue (no single “cash cow” for most).
Design & product attributes (consumer preferences for customization)
- Single-color custom product options are most popular across apparel & non-apparel.
- Products with a limited range of 1–5 color options generate about 70% more sales than those offering more than five choices, suggesting that too much variety can overwhelm customers and reduce conversions.
- Over 50% of non-apparel custom products sales involve single-color products; single-size non-apparel items account for 60% of eligible annual sales.
- Most custom apparel sellers offer 6–8 size options (typically XS–4XL), with Medium, Large, and Extra-Large being the most purchased sizes.
- Custom products featuring only 1–2 design elements dominate the market, with single-element designs accounting for 56% of sales and two-element designs adding another 24%.
Sources: Do Dropshipping, eMarketer, Printify, Statista, Gelato, Bain & Company, Business 2 Community
Revenue and Profit for Custom Product Brands
- Typical custom products retailer margins are nearer to 20–30% depending on product & channel.
- Top-selling customized products average 40–50% profit margins, with apparel at ~40%, mugs at ~45%, candles at ~60%, and paper goods reaching as high as 76%.
- Average time to reach the first $1,000 in revenue is ~165 days for typical custom-product retailers, with top merchants reaching this milestone in under 118 days.
Average Profit Margins by Product Category
| Product Category | Average Profit Margin |
| Top-Selling Products | 40–50% |
| Apparel | ~40% |
| Mugs | ~45% |
| Candles | ~60% |
| Paper Goods | Up to 76% |
Profit Margins for Specific Products
| Product | Profit Margin (Up To) |
| Men’s Cotton Crew Tee | 50% |
| Unisex Jersey Tee | 53% |
| Accent Coffee Mug (11 oz) | 70% |
| Ceramic Mug (15 oz) | 71% |
| Hardcover Matte Journal | 70% |
Apps, themes, payments & tech
- 63.1% of top 1% customization stores run more than 10 apps/extensions.
- The average customization store spends around $76/month on apps.
- The most common payment methods offered by brands with customization options are PayPal (most prevalent), then Apple Pay, Shop Pay, and Google Pay.
- Popular premium themes among customization stores include Impulse, Motion, and Warehouse.
Marketing, Social & Consumer drivers for Custom Goods Retailers
- As attention spans fall, offering customization and personalization can deliver 5–8× higher returns on marketing spend and lift sales by 10% or more
- Around 22.5% of brands offering custom products maintain a blog.
- Stores with a blog rank ~1,982,502 positions better on The top 1% of customization stores average ~897,178 combined social followers.
- Roughly 49.4% of consumers of custom goods retailers say free delivery is the single most important online purchase driver.
- ~14.8% of customization stores have the TikTok Pixel installed (proxy for TikTok ad use).
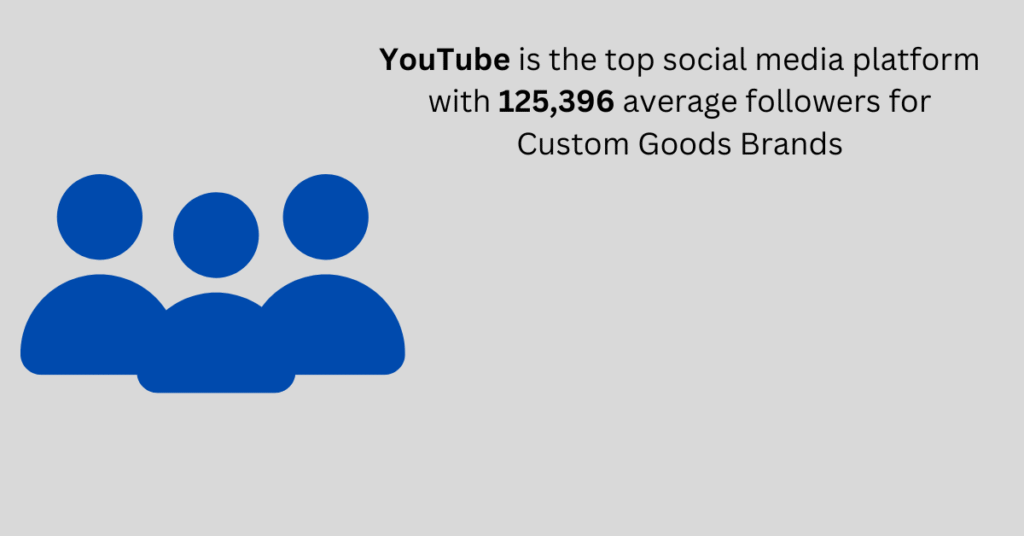
- YouTube is the top social media platform with 125,396 average followers, followed by TikTok with 93,077 followers for custom goods brands.
Average Social Followers by Channel for Custom Products Brands
| Platform | Average Followers |
| YouTube | ~125,396 |
| TikTok | ~93,077 |
| ~78,352 | |
| Twitter/X | ~68,956 |
| ~64,571 | |
| ~2,386 |
Sources: eMarketer, Printify, Statista, Gelato, Bain & Company, Google Trends, Business 2 Community, Do Dropshipping
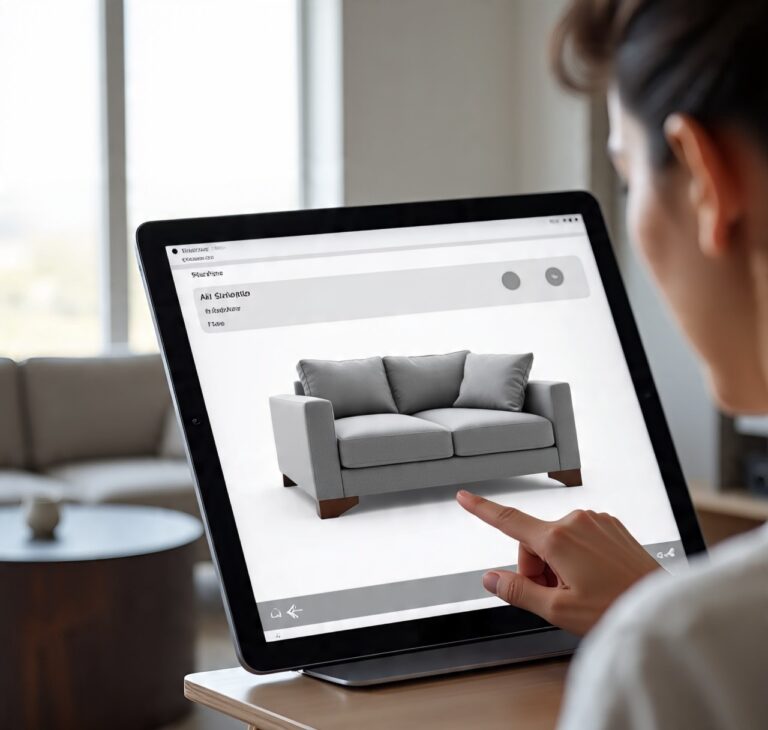
Product Configurators’ impact on customization
- Rich product configurators and advanced visualization tools can increase conversion rates by up to 50%.
- 82% of shoppers activate 3D views when available, showing that configurators naturally draw customers into customizing and exploring products in more detail.
- Shoppers spend an average of 20–30 seconds interacting with configurators, which means they actively engage with customizable features rather than passively scrolling past.
- 95% prefer interactive 3D over video, confirming that configurators help buyers visualize customizations more confidently than static or linear formats.
- Retailers using 3D configurators report a 10–30% lift in conversion, proving that interactive customization experiences directly drive sales.
- Stores saw a 6x increase in time-on-page with configurators, indicating that buyers spend longer exploring and personalizing products before checkout.
- Interactive 3D delivers 40% higher conversions than traditional marketing
- Configurators reduce returns and inquiries, since customers can preview customized designs in 3D before purchase, leading to better decision-making.
- For retailers, the most important features of configurators are smooth rotation, high-res zoom, fast load speeds, and easy catalog sync — all critical for showcasing bespoke options.
- 86% of retailers cite reduced returns as a core reason for adopting 3D configurators, aligning with the fact that better product visualization lowers post-purchase dissatisfaction.
- A majority of retailers (57%) require at least a 5–15% conversion boost to justify investment — configurators consistently meet or exceed this threshold, validating them as a growth driver.
- 93% of Snapchatters are interested in using AR for shopping, showing huge demand for configurator-like tools that let them personalize and preview products before purchase.
- Implementing a configurator increased attachment/upsell rates by ~15% in a major furniture rollout, demonstrating that visual configuration drives complementary purchases.
- A configurable commerce experience helped one retailer deliver 26.4% sales growth after launching its interactive product customizer, proving configurators can materially grow revenue.
- Product-experience improvements (including configurators) produced a 44% rise in conversion rate, a 128% increase in revenue per visitor, and a 37% increase in average order value in a documented retail case, showing configurators boost both conversion and order economics.
- High-quality 3D configurators can cut the need for traditional photography workflows (vendor reports cite up to ~90% savings in product photography), lowering content costs for many SKUs.
- After implementing a real-time 3D user experience, Audi saw a 9% increase in the selection of extra features per vehicle, which significantly boosted cart value.
- 81% of contract interior designers have used a manufacturer’s online 3D configuration tool to customize office furniture.
- 90% of contract interior designers say 3d configurators are extremely or very helpful in making their final purchase decisions for customized products.
- 70% of contract interior designers report being more loyal to manufacturers and dealers that provide 3D configurators.
- 75% of contract interior designers want he ability to configure and place orders directly through the manufacturer’s 3D tools.
- 70% of contract interior designers now expect manufacturers to offer 3D configurators as a standard option in the buying process.
Sources: McKensey, Cappasity, Ctf Assets, GroupBy, Adobe, Corra, Zolak.Pure Web, Amazon, PR Newswire
Stats on Customization’s Impact on Sustainability
- Additive manufacturing reduced CO₂e emissions by 24.8% and saved around 50% of material waste compared to traditional methods, highlighting the greener benefits of on-demand customization.
- Nearly 45% of European consumers who purchase custom apparel state that sustainability is a key influence on their buying decisions.
- Fit-related returns fell by 24% for multi-brand retailers and up to 50% for single-brand DTC retailers after sizing customization, significantly cutting waste and emissions tied to returns.
- Virtual try-on and AR tools have been shown to cut returns by 20–36% in pilots, lowering the transport and disposal impact of unwanted items.
- VR/AR shopping tools lowered return rates by up to 25% while boosting sales, showing that customization technology both reduces waste and increases efficiency.
- Topology-optimized additive manufacturing can cut material use by 35–65% and energy consumption by 59–91%, making low-volume custom production more sustainable than mass production.
- Custom print-to-textile manufacturing saved around 300,000 liters of water and cut electrical energy use by over 64%, reducing reliance on resource-heavy processes.
Sources: Customcy, True Fit, Shopify 1, ScienceDirect, Stratasys, NIH 1, BrandXR, Coresight, Shopify 2, NIH 2
Stats on 3D Printing / Additive Manufacturing Enabling Customization
- Over 48% of 3D-printed consumer products are purchased because they meet specific customer needs not served by mass production, underscoring demand-driven customization.
- 77% of 3D printing users say customization options significantly enhance their experience, highlighting that tailored options drive satisfaction.
- 72% of companies now produce personalized items on demand via 3D printing, demonstrating how AM enables mass customization workflows.
- 63% of users report that the ability to customize products via 3D printing boosts their satisfaction, showing customization is core to the experience.
- In the custom product category of eyewear frames, production volumes are increasing 25% annually, driven by 3D-printed bespoke designs.
- Rapid prototyping, noted by 63% of consumers, is the top benefit impacting satisfaction in 3D printing, showing the customization loop is key to positive user experience.
- 44% of B2B customers prefer 3D-printed spare parts due to faster service, indicating that tailored replacement components are valued.
Sources: Gitnux, WifiTalents, AM Chronicle
Modular Design and Customization
- Product development time can be reduced by up to 50% with modular design, enabling faster rollout of customizable configurations.
- Companies using modular systems report 15–20% higher customer satisfaction due to their ability to deliver targeted customization more responsively.
- Firms implementing modular architectures enjoy 20–25% stronger market responsiveness, making it easier to introduce bespoke variants quickly.
- Modular assembly in engineering projects has reduced project costs by up to 15% and delivery times by up to 20%, supporting scalable bespoke production.
- Modular construction can reduce building waste by up to 90%, underlining the environmental value of reusable modules in customized architecture.
- Prefabricated modular building sections can cut construction time by 20–50%, facilitating quicker deployment of custom-building designs.
- In oil and gas, modular engineering led to up to 15% cost savings and 20% faster delivery, demonstrating that standardized modules facilitate customization and efficiency.
Sources: Number Analytics, Number Analytics, Control Engineering, Wikipedia, Wikipedia
Augmented Reality (AR) / Virtual Try-Ons and customization
- Customers who engage with AR try-on are about 90% more likely to convert, showing that immersive previews strongly boost purchase confidence for customized items.
- Virtual try-on implementations have increased sales by as much as 30% while cutting returns by roughly 20%, improving both revenue and sustainability for configurable products.
- Retail pilots report that virtual try-on and AR tools reduce return rates by 20–36%, directly lowering transport, processing costs, and associated emissions.
- Surveys show roughly 61% of shoppers prefer retailers that offer AR experiences, and about 71% say they would shop more often if AR were available, indicating strong consumer demand for AR-enabled customization.
- Aggregated industry data indicate virtual-try-on use cases typically increase sales by ~30% while reducing returns by ~20%, making AR a high-impact lever for scaling made-to-order and configurable SKUs.
- Industry surveys find that 85% of apparel brands and retailers currently use or plan to implement virtual try-on tools, signaling broad adoption that supports widespread reduction in fit-related returns.
Sources: Forbes, BrandXR, ScienceDirect, Threekit, BrandXR, Focal Systems, Banuba, Vogue Business